2. Three events are shown on the Venn Diagram in the following figure: B D² A C Reproduce the figure and shade the region that corresponds to each of the following events. (a) (An B) U (BNC) (b) (AUB) nC (c) (BUC)' (d) (An B)' U C'
2. Three events are shown on the Venn Diagram in the following figure: B D² A C Reproduce the figure and shade the region that corresponds to each of the following events. (a) (An B) U (BNC) (b) (AUB) nC (c) (BUC)' (d) (An B)' U C'

Algebra and Trigonometry (MindTap Course List)
4th Edition
ISBN:9781305071742
Author:James Stewart, Lothar Redlin, Saleem Watson
Publisher:James Stewart, Lothar Redlin, Saleem Watson
Chapter14: Counting And Probability
Section14.2: Probability
Problem 4E: Let E and F be events in a sample space S. aThe probability of E and F occurring is...

Related questions
Question
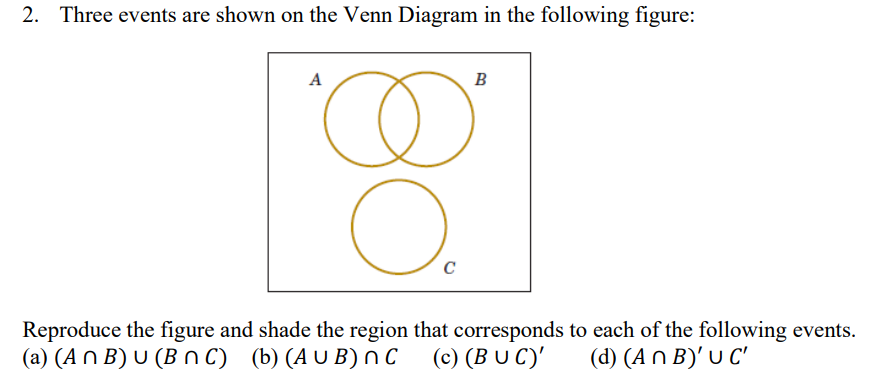
Transcribed Image Text:2. Three events are shown on the Venn Diagram in the following figure:
A
O.
C
B
Reproduce the figure and shade the region that corresponds to each of the following events.
(a) (An B) U (BNC) (b) (AUB) nC
u
(c) (BUC)' (d) (An B)' U C'
Expert Solution
This question has been solved!
Explore an expertly crafted, step-by-step solution for a thorough understanding of key concepts.

This is a popular solution!

Trending now
This is a popular solution!

Step by step
Solved in 4 steps with 8 images

Recommended textbooks for you
Algebra and Trigonometry (MindTap Course List)
Algebra
ISBN:
9781305071742
Author:
James Stewart, Lothar Redlin, Saleem Watson
Publisher:
Cengage Learning
Algebra and Trigonometry (MindTap Course List)
Algebra
ISBN:
9781305071742
Author:
James Stewart, Lothar Redlin, Saleem Watson
Publisher:
Cengage Learning