2.11.1 Problems 2.1 Consider the following five observations. You are to do all the parts of this exercise using only a calculator. X 3 2 1 -1 y 4 2 3 1 0 0 Σx = | Σy = | Σ(x − 1) = ہ لیا Σ(x-7)(y₁ - y) = a. Complete the entries in the table. Put the sums in the last row. What are the sample means x and y? b. Calculate b, and by using (2.7) and (2.8) and state their interpretation. c. Compute Σ Σ *y. Using these numerical values, show that Σ(x – F) = 2x – Nx and Σ(x-7)(y-7)= Σxy-№xy. =1 d. Use the least squares estimates from part (b) to compute the fitted values of y, and complete the remainder of the table below. Put the sums in the last row. X₁ 3 x-x 2 1 Calculate the sample variance of y. s= (-3)/(N-1), the sample variance of x, $=(x₁ - x)²/(N-1), the sample covariance between x and y, s,,= (N-1), the sample correlation between x and y, r, s,/(s,s,) and the coefficient of variation of x, CV, = 100(s/x). What is the median, 50th percentile, of x? (₁-3)(x₁ - x)/ = -1 0 Σ(x₁ - x)² = Y₁ 4 2 3 y-y ŷ₁ ê Σ(ν. – 5) = (x-x)(y-y) ê xe 1 0 MW Σy = Σ=Σ = Σ = Σx = e. On graph paper, plot the data points and sketch the fitted regression line ŷ, b₁ + b₂x₁. f. On the sketch in part (e), locate the point of the means (x,y). Does your fitted line pass through that point? If not, go back to the drawing board, literally. g. Show that for these numerical values y = b₁ + b₂. h. Show that for these numerical values y = y, where y = Ey/N. i. Compute ở. j. Compute var (b₂lx) and se(b₂). 2.2 A household has weekly income of $2000. The mean weekly expenditure for households with this income is E(ylx = $2000)=Hy-$2000 = $220, and expenditures exhibit variance var(ylx = $2,000) = $2,000 = $121. yr llu distributed find the probability that a house
2.11.1 Problems 2.1 Consider the following five observations. You are to do all the parts of this exercise using only a calculator. X 3 2 1 -1 y 4 2 3 1 0 0 Σx = | Σy = | Σ(x − 1) = ہ لیا Σ(x-7)(y₁ - y) = a. Complete the entries in the table. Put the sums in the last row. What are the sample means x and y? b. Calculate b, and by using (2.7) and (2.8) and state their interpretation. c. Compute Σ Σ *y. Using these numerical values, show that Σ(x – F) = 2x – Nx and Σ(x-7)(y-7)= Σxy-№xy. =1 d. Use the least squares estimates from part (b) to compute the fitted values of y, and complete the remainder of the table below. Put the sums in the last row. X₁ 3 x-x 2 1 Calculate the sample variance of y. s= (-3)/(N-1), the sample variance of x, $=(x₁ - x)²/(N-1), the sample covariance between x and y, s,,= (N-1), the sample correlation between x and y, r, s,/(s,s,) and the coefficient of variation of x, CV, = 100(s/x). What is the median, 50th percentile, of x? (₁-3)(x₁ - x)/ = -1 0 Σ(x₁ - x)² = Y₁ 4 2 3 y-y ŷ₁ ê Σ(ν. – 5) = (x-x)(y-y) ê xe 1 0 MW Σy = Σ=Σ = Σ = Σx = e. On graph paper, plot the data points and sketch the fitted regression line ŷ, b₁ + b₂x₁. f. On the sketch in part (e), locate the point of the means (x,y). Does your fitted line pass through that point? If not, go back to the drawing board, literally. g. Show that for these numerical values y = b₁ + b₂. h. Show that for these numerical values y = y, where y = Ey/N. i. Compute ở. j. Compute var (b₂lx) and se(b₂). 2.2 A household has weekly income of $2000. The mean weekly expenditure for households with this income is E(ylx = $2000)=Hy-$2000 = $220, and expenditures exhibit variance var(ylx = $2,000) = $2,000 = $121. yr llu distributed find the probability that a house

Linear Algebra: A Modern Introduction
4th Edition
ISBN:9781285463247
Author:David Poole
Publisher:David Poole
Chapter4: Eigenvalues And Eigenvectors
Section4.6: Applications And The Perron-frobenius Theorem
Problem 22EQ

Related questions
Question
Please solve 2.1 in its entirety, thanks!
Transcribed Image Text:are car-
y independent of the jth pair
to collect data pairs (y,x)
ationship between x, and e;.
dent of e, if i j. Then, the
is, and the implications are
independent,
ata pairs are
re uncorrelated.
e assumptions? They are
de; (Section 2.10.1) and
es estimators are the best
on x they have a normal
rs, (y₁x₁), i = 1, ..., N,
ent and identically dis-
data are iid. This is a
pulation.
showed how the strict
is correlation between
eity fails with random
elated with a value x¡
ndom Sampling
= 1,..., N, where
m.
airs and have the
ibuted.
uction process by
costs. The error
m's managers. It
action process, so
m's input usage is
error, e. A firm's
endogenous.
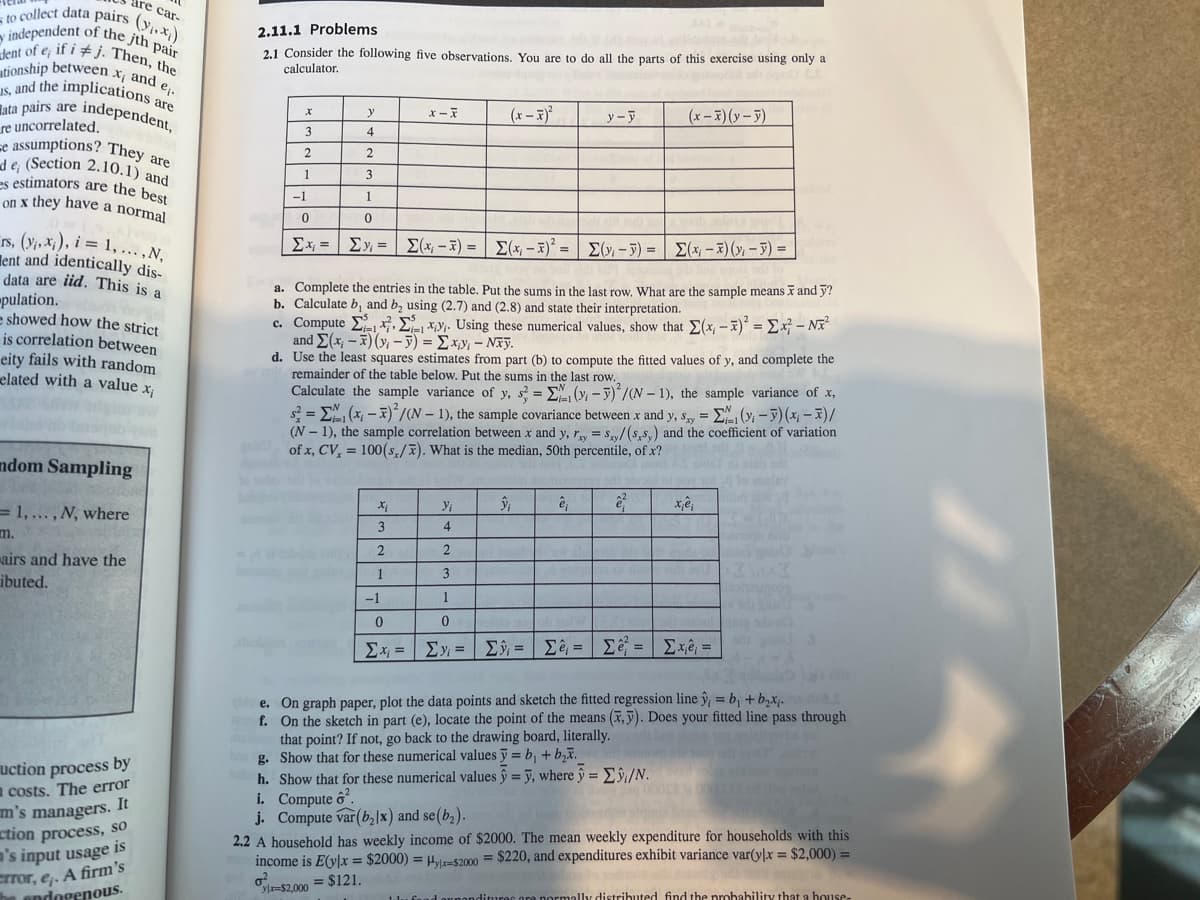
2.11.1 Problems
2.1 Consider the following five observations. You are to do all the parts of this exercise using only at
calculator.
x
3
2
1
-1
0
Σx =
y
4
2
3
1
Σ» = | Σ(x − x) =
x-x
Xi
3
2
1
-1
(x-x)²
a. Complete the entries in the table. Put the sums in the last row. What are the sample means x and y?
b. Calculate b, and by using (2.7) and (2.8) and state their interpretation.
c. Compute Σy. Using these numerical values, show that Σ(x₁ - x)² = x² - Nx²
and Σ(x − x)(y – 5) = Σxy – Nxy.
d. Use the least squares estimates from part (b) to compute the fitted values of y, and complete the
remainder of the table below. Put the sums in the last row.
Calculate the sample variance of y, s= E(-y)/(N-1), the sample variance of x,
s²=Σ(x₁ - x)²/(N-1), the sample covariance between x and y, sy = (₁-3)(x-x)/
(N-1), the sample correlation between x and y, r = sxy/(s,s,) and the coefficient of variation
of x, CV, = 100(s,/). What is the median, 50th percentile, of x?
y-y
2(x − x) = | Σ( − 5) = | Σ(x − x)(y - 5) =
ŷ₁
Y₁
4
2
3
1
0
0
Σx = | Σy = | Σ= | Σê=Σ = Σx =
ê₁
lalu fand ornan
(x-x)(y-y)
that point? If not, go back to the drawing board, literally.
g. Show that for these numerical values y=b₁ + b₂.
h. Show that for these numerical values ŷ = y, where ŷ = Σŷ/N.
i. Compute 6².
j. Compute var (b₂lx) and se (b₂).
xiê;
e. On graph paper, plot the data points and sketch the fitted regression line ŷ, = b₁ + b₂x₁.
ana.s
f.
On the sketch in part (e), locate the point of the means (x,y). Does your fitted line pass through
2.2 A household has weekly income of $2000. The mean weekly expenditure for households with this
income is E(ylx = $2000) =Hy-$2000 = $220, and expenditures exhibit variance var(ylx = $2,000) =
yix-$2,000 = $121.
o²
mally distributed find the probability that a house-
Expert Solution
This question has been solved!
Explore an expertly crafted, step-by-step solution for a thorough understanding of key concepts.

This is a popular solution!

Trending now
This is a popular solution!

Step by step
Solved in 7 steps with 2 images

Recommended textbooks for you
Linear Algebra: A Modern Introduction
Algebra
ISBN:
9781285463247
Author:
David Poole
Publisher:
Cengage Learning

Algebra & Trigonometry with Analytic Geometry
Algebra
ISBN:
9781133382119
Author:
Swokowski
Publisher:
Cengage

Glencoe Algebra 1, Student Edition, 9780079039897…
Algebra
ISBN:
9780079039897
Author:
Carter
Publisher:
McGraw Hill
Linear Algebra: A Modern Introduction
Algebra
ISBN:
9781285463247
Author:
David Poole
Publisher:
Cengage Learning
Algebra & Trigonometry with Analytic Geometry
Algebra
ISBN:
9781133382119
Author:
Swokowski
Publisher:
Cengage
Glencoe Algebra 1, Student Edition, 9780079039897…
Algebra
ISBN:
9780079039897
Author:
Carter
Publisher:
McGraw Hill

Elementary Linear Algebra (MindTap Course List)
Algebra
ISBN:
9781305658004
Author:
Ron Larson
Publisher:
Cengage Learning

Big Ideas Math A Bridge To Success Algebra 1: Stu…
Algebra
ISBN:
9781680331141
Author:
HOUGHTON MIFFLIN HARCOURT
Publisher:
Houghton Mifflin Harcourt