200 398 1059 202 399 808 331 660 1228 169 318 199 247 490 261 230 485 172

Algebra & Trigonometry with Analytic Geometry
13th Edition
ISBN:9781133382119
Author:Swokowski
Publisher:Swokowski
Chapter10: Sequences, Series, And Probability
Section10.8: Probability
Problem 31E

Related questions
Question
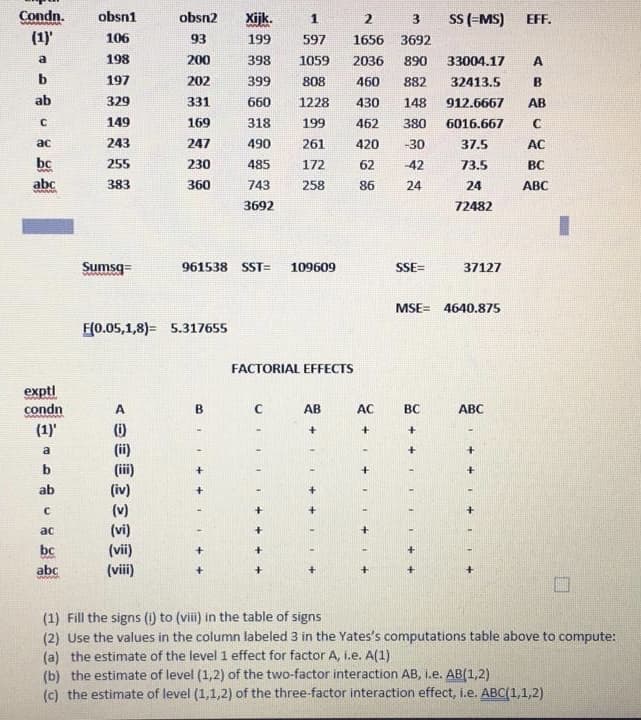
Transcribed Image Text:Condn.
obsn1
Xijk.
SS (-MS)
obsn2
3.
EFF.
(1)
106
93
199
597
1656
3692
a
198
200
398
1059
2036
890
33004.17
A
b
197
202
399
808
460
882
32413.5
ab
329
331
660
1228
430
148
912.6667
AB
149
169
318
199
462
380
6016.667
ас
243
247
490
261
420
-30
37.5
AC
bc
255
230
485
172
62
-42
73.5
BC
abc
383
360
743
258
86
24
24
ABC
3692
72482
Sumsg=
961538 SST=
109609
SSE=
37127
MSE= 4640.875
F(0.05,1,8)= 5.317655
FACTORIAL EFFECTS
exptl
condn
A.
AB
AC
BC
ABC
(1)'
(i)
(ii)
a
(iii)
ab
(iv)
(v)
(vi)
(vii)
ac
bc
abc
(viii)
www.
(1) Fill the signs (i) to (viii) in the table of signs
(2) Use the values in the column labeled 3 in the Yates's computations table above to compute:
(a) the estimate of the level 1 effect for factor A, i.e. A(1)
(b) the estimate of level (1,2) of the two-factor interaction AB, i.e. AB(1,2)
(c) the estimate of level (1,1,2) of the three-factor interaction effect, i.e. ABC(1,1,2)
Expert Solution
This question has been solved!
Explore an expertly crafted, step-by-step solution for a thorough understanding of key concepts.

This is a popular solution!

Trending now
This is a popular solution!

Step by step
Solved in 2 steps

Recommended textbooks for you
Algebra & Trigonometry with Analytic Geometry
Algebra
ISBN:
9781133382119
Author:
Swokowski
Publisher:
Cengage

Glencoe Algebra 1, Student Edition, 9780079039897…
Algebra
ISBN:
9780079039897
Author:
Carter
Publisher:
McGraw Hill
Algebra & Trigonometry with Analytic Geometry
Algebra
ISBN:
9781133382119
Author:
Swokowski
Publisher:
Cengage
Glencoe Algebra 1, Student Edition, 9780079039897…
Algebra
ISBN:
9780079039897
Author:
Carter
Publisher:
McGraw Hill