210 270 315 4 380 475 630 On the following graph, plot Douglas Fur's average total cost (ATC) curve using the green points (triangle symbol). Next, plot its avera (AVC) curve using the purple points (diamond symbol). Finally, plot its marginal cost (MC) curve using the orange points (square sym! ATC and AVC, plot the points on the integer; for example, the ATC of producing one pair of boots is $210, so you should start your AT placing a green point at (1, 210). For MC, plot the points between the integers: For example, the MC of increasing production from zer boots is $90, so you should start your MC curve by placing an orange square at (o.5, 90).)
210 270 315 4 380 475 630 On the following graph, plot Douglas Fur's average total cost (ATC) curve using the green points (triangle symbol). Next, plot its avera (AVC) curve using the purple points (diamond symbol). Finally, plot its marginal cost (MC) curve using the orange points (square sym! ATC and AVC, plot the points on the integer; for example, the ATC of producing one pair of boots is $210, so you should start your AT placing a green point at (1, 210). For MC, plot the points between the integers: For example, the MC of increasing production from zer boots is $90, so you should start your MC curve by placing an orange square at (o.5, 90).)

Principles of Microeconomics (MindTap Course List)
8th Edition
ISBN:9781305971493
Author:N. Gregory Mankiw
Publisher:N. Gregory Mankiw
Chapter13: The Cost Of Production
Section: Chapter Questions
Problem 1PA

Related questions
Question
Please help solve and explain
Transcribed Image Text:Homework (Ch 13)
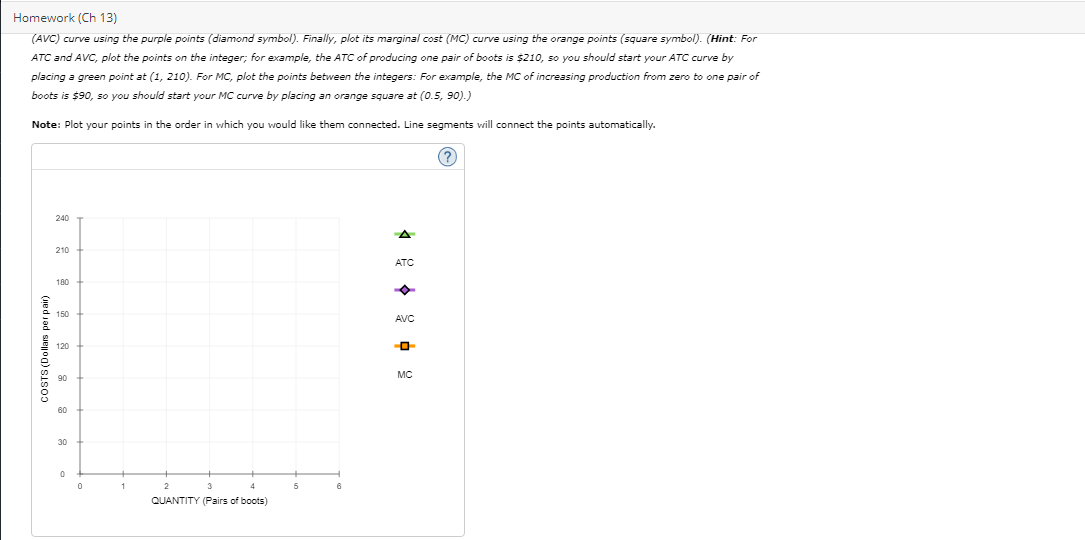
(AVC) curve using the purple points (diamond symbol). Finally, plot its marginal cost (MC) curve using the orange points (square symbol). (Hint: For
ATC and AVC, plot the points on the integer; for example, the ATC of producing one pair of boots is $210, so you should start your ATC curve by
placing a green point at (1, 210). For MC, plot the points between the integers: For example, the MC of increasing production from zero to one pair of
boots is $90, so you should start your MC curve by placing an orange square at (0.5, 90).)
Note: Plot your points in the order in which you would like them connected. Line segments will connect the points automatically.
(?)
240
210
ATC
180
150
AVC
120
MC
90
60
30
QUANTITY (Pairs of boots)
COSTS (Dollars per pair)
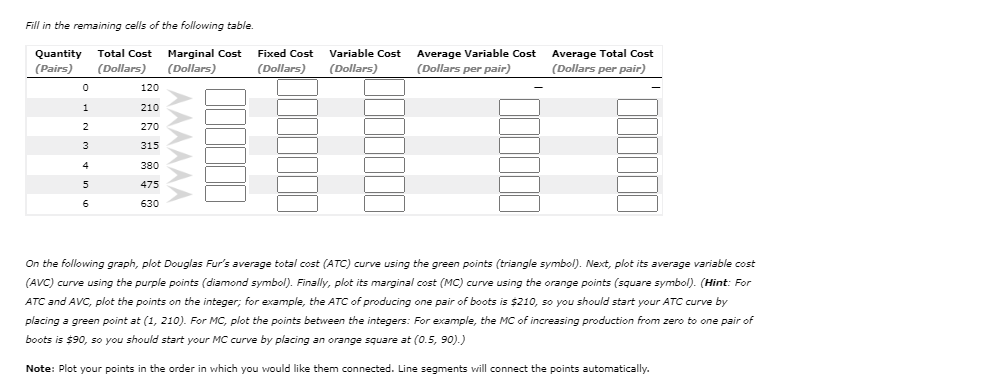
Transcribed Image Text:Fill in the remaining cells of the following table.
Quantity Total Cost
(Pairs)
Marginal Cost
(Dollars)
Average Variable Cost
(Dollars per pair)
Average Total Cost
(Dollars per pair)
Fixed Cost
Variable Cost
(Dollars)
(Dollars)
(Dollars)
120
210
2
270
3
315
4
380
5
475
630
On the following graph, plot Douglas Fur's average total cost (ATC) curve using the green points (triangle symbol). Next, plot its average variable cost
(AVC) curve using the purple points (diamond symbol). Finally, plot its marginal cost (MC) curve using the orange points (square symbol). (Hint: For
ATC and AVC, plot the points on the integer; for example, the ATC of producing one pair
f boots is $210, so you should start your ATC curve by
placing a green point at (1, 210). For MC, plot the points between the integers: For example, the MC of increasing production from zero to one pair of
boots is $90, so you should start your MC curve by placing an orange square at (0.5, 90).)
Note: Plot your points in the order in which you would like them connected. Line segments will connect the points automatically.
Expert Solution
This question has been solved!
Explore an expertly crafted, step-by-step solution for a thorough understanding of key concepts.

Step by step
Solved in 2 steps with 1 images

Knowledge Booster


Learn more about
Need a deep-dive on the concept behind this application? Look no further. Learn more about this topic, economics and related others by exploring similar questions and additional content below.Recommended textbooks for you
Principles of Microeconomics (MindTap Course List)
Economics
ISBN:
9781305971493
Author:
N. Gregory Mankiw
Publisher:
Cengage Learning

Principles of Economics, 7th Edition (MindTap Cou…
Economics
ISBN:
9781285165875
Author:
N. Gregory Mankiw
Publisher:
Cengage Learning

Principles of Economics (MindTap Course List)
Economics
ISBN:
9781305585126
Author:
N. Gregory Mankiw
Publisher:
Cengage Learning
Principles of Microeconomics (MindTap Course List)
Economics
ISBN:
9781305971493
Author:
N. Gregory Mankiw
Publisher:
Cengage Learning
Principles of Economics, 7th Edition (MindTap Cou…
Economics
ISBN:
9781285165875
Author:
N. Gregory Mankiw
Publisher:
Cengage Learning
Principles of Economics (MindTap Course List)
Economics
ISBN:
9781305585126
Author:
N. Gregory Mankiw
Publisher:
Cengage Learning

Essentials of Economics (MindTap Course List)
Economics
ISBN:
9781337091992
Author:
N. Gregory Mankiw
Publisher:
Cengage Learning


Microeconomics: Private and Public Choice (MindTa…
Economics
ISBN:
9781305506893
Author:
James D. Gwartney, Richard L. Stroup, Russell S. Sobel, David A. Macpherson
Publisher:
Cengage Learning