22.) Using the parameter estimates in the JMP output, is there a problem with multicollinearity? YES NO CANNOT ASSESS Justification: What other method(s) may be used to assess multicollinearity?
22.) Using the parameter estimates in the JMP output, is there a problem with multicollinearity? YES NO CANNOT ASSESS Justification: What other method(s) may be used to assess multicollinearity?

Algebra & Trigonometry with Analytic Geometry
13th Edition
ISBN:9781133382119
Author:Swokowski
Publisher:Swokowski
Chapter10: Sequences, Series, And Probability
Section10.8: Probability
Problem 32E

Related questions
Question
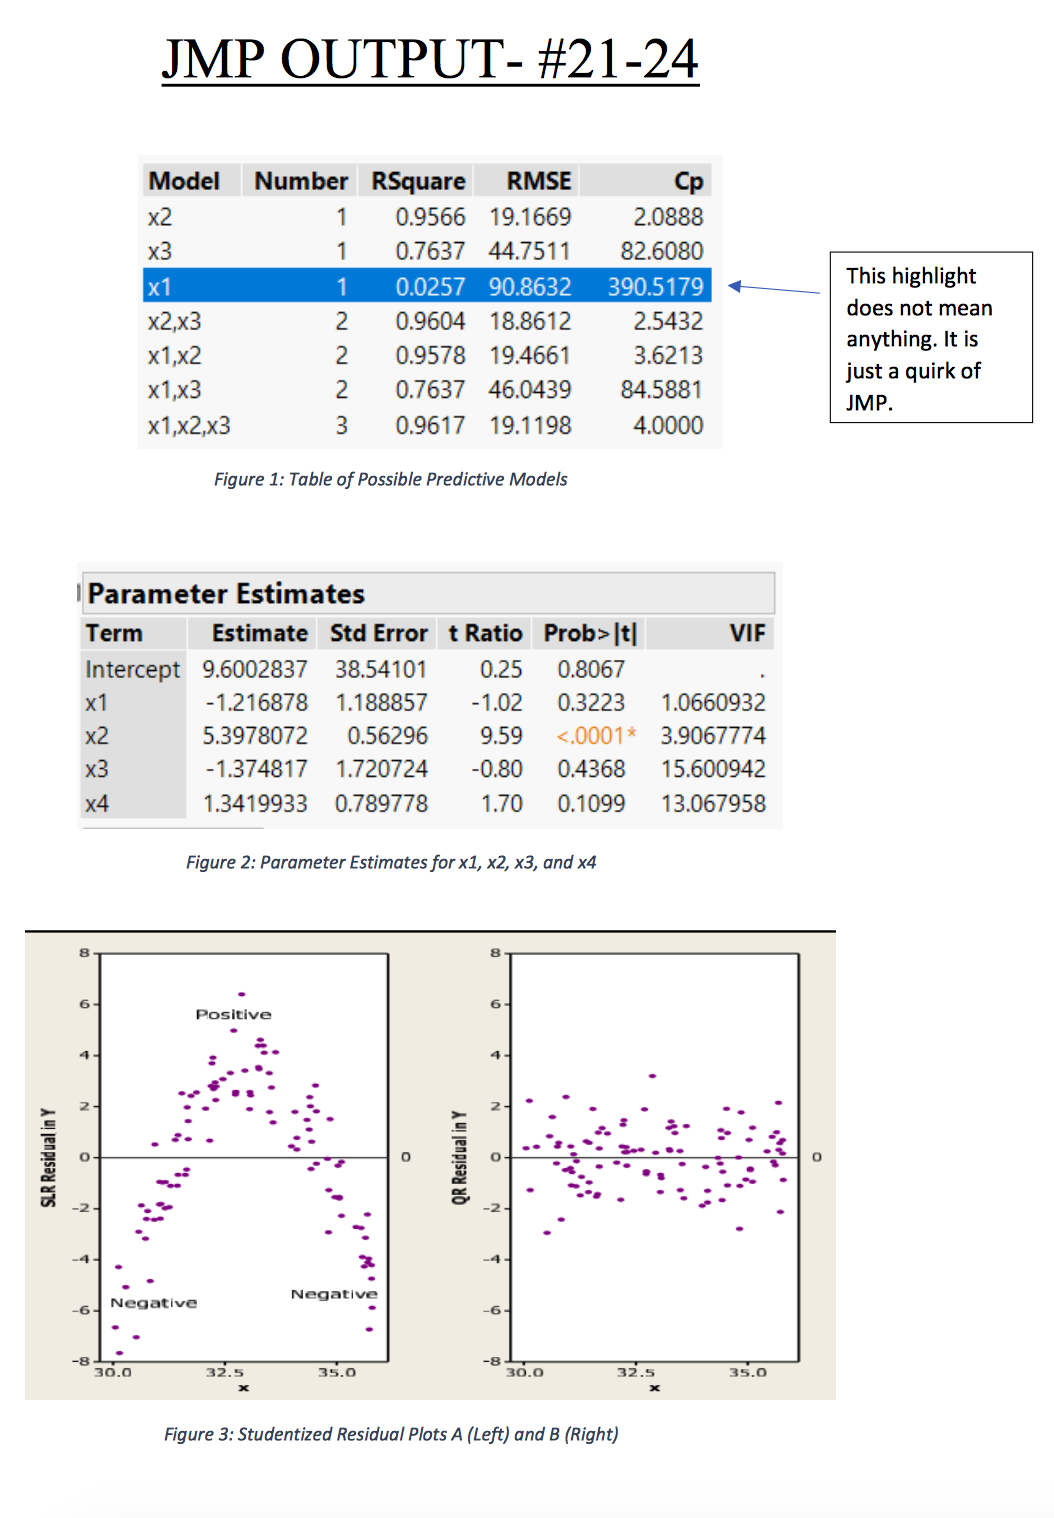
22.) Using the parameter estimates in the JMP output, is there a problem with multicollinearity?
YES NO CANNOT ASSESS
Justification:
What other method(s) may be used to assess multicollinearity?
Transcribed Image Text:JMP OUTPUT- #21-24
Model
Number RSquare
RMSE
Cp
x2
1
0.9566 19.1669
2.0888
x3
1
0.7637 44.7511
82.6080
This highlight
x1
1
0.0257 90.8632
390.5179
does not mean
x2,x3
0.9604 18.8612
2.5432
anything. It is
just a quirk of
х1,х2
2
0.9578 19.4661
3.6213
х1,x3
2
0.7637 46.0439
84.5881
JMP.
х1,x2,x3
3
0.9617 19.1198
4.0000
Figure 1: Table of Possible Predictive Models
Parameter Estimates
Term
Estimate Std Error t Ratio Prob> |t|
VIF
Intercept 9.6002837
38.54101
0.25
0.8067
х1
-1.216878
1.188857
-1.02
0.3223
1.0660932
x2
5.3978072
0.56296
9.59
<.0001* 3.9067774
x3
-1.374817 1.720724
-0.80
0.4368
15.600942
x4
1.3419933
0.789778
1.70
0.1099
13.067958
Figure 2: Parameter Estimates for x1, x2, x3, and x4
6-
6-
Positive
4
4
-4.
-4-
Negative
Negative
-6-
-6-
-8
30.0
32.5
35.0
-8
30.0
32.5
35.0
Figure 3: Studentized Residual Plots A (Left) and B (Right)
SLR Residual in Y
QR Residual in Y
Expert Solution
This question has been solved!
Explore an expertly crafted, step-by-step solution for a thorough understanding of key concepts.

This is a popular solution!

Trending now
This is a popular solution!

Step by step
Solved in 3 steps

Knowledge Booster


Learn more about
Need a deep-dive on the concept behind this application? Look no further. Learn more about this topic, statistics and related others by exploring similar questions and additional content below.Recommended textbooks for you
Algebra & Trigonometry with Analytic Geometry
Algebra
ISBN:
9781133382119
Author:
Swokowski
Publisher:
Cengage

Glencoe Algebra 1, Student Edition, 9780079039897…
Algebra
ISBN:
9780079039897
Author:
Carter
Publisher:
McGraw Hill
Algebra & Trigonometry with Analytic Geometry
Algebra
ISBN:
9781133382119
Author:
Swokowski
Publisher:
Cengage
Glencoe Algebra 1, Student Edition, 9780079039897…
Algebra
ISBN:
9780079039897
Author:
Carter
Publisher:
McGraw Hill