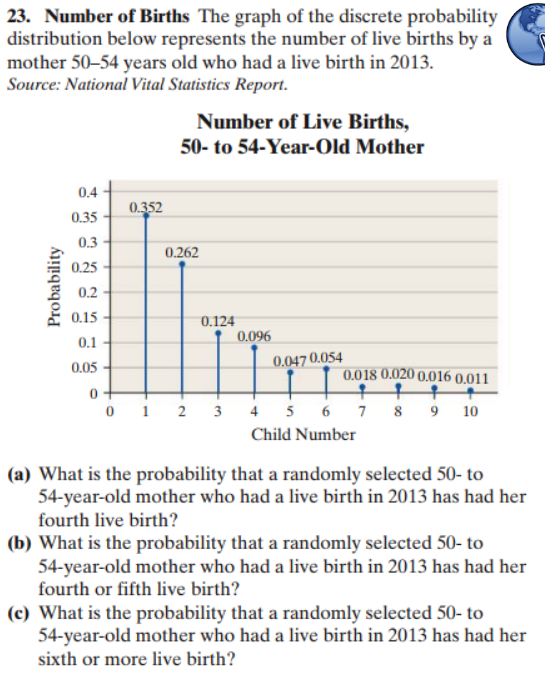
23. Number of Births The graph of the discrete probability distribution below represents the number of live births by a mother 50-54 years old who had a live birth in 2013. Source: National Vital Statistics Report. Number of Live Births, 50-to 54-Year-Old Mother 0.4 0.352 0.35 0.3 0.262 0.25 0.2 0.15 0.124 0.096 0.1 0.047 0.054 0.05 0.018 0.020 0.016 0.011 8 9 10 5 6 7 0 1 2 3 4 Child Number (a) What is the probability that a randomly selected 50- to 54-year-old mother who had a live birth in 2013 has had her fourth live birth? (b) What is the probability that a randomly selected 50- to 54-year-old mother who had a live birth in 2013 has had her fourth or fifth live birth? (c) What is the probability that a randomly selected 50- to 54-year-old mother who had a live birth in 2013 has had her sixth or more live birth? Probability
23. Number of Births The graph of the discrete probability distribution below represents the number of live births by a mother 50-54 years old who had a live birth in 2013. Source: National Vital Statistics Report. Number of Live Births, 50-to 54-Year-Old Mother 0.4 0.352 0.35 0.3 0.262 0.25 0.2 0.15 0.124 0.096 0.1 0.047 0.054 0.05 0.018 0.020 0.016 0.011 8 9 10 5 6 7 0 1 2 3 4 Child Number (a) What is the probability that a randomly selected 50- to 54-year-old mother who had a live birth in 2013 has had her fourth live birth? (b) What is the probability that a randomly selected 50- to 54-year-old mother who had a live birth in 2013 has had her fourth or fifth live birth? (c) What is the probability that a randomly selected 50- to 54-year-old mother who had a live birth in 2013 has had her sixth or more live birth? Probability

College Algebra
7th Edition
ISBN:9781305115545
Author:James Stewart, Lothar Redlin, Saleem Watson
Publisher:James Stewart, Lothar Redlin, Saleem Watson
Chapter9: Counting And Probability
Section9.3: Binomial Probability
Problem 33E: Sick leave probability that a given worker at Dyno Nutrition Will call in sick on a Monday is 004....

Related questions
Question
Transcribed Image Text:23. Number of Births The graph of the discrete probability
distribution below represents the number of live births by a
mother 50-54 years old who had a live birth in 2013.
Source: National Vital Statistics Report.
Number of Live Births,
50-to 54-Year-Old Mother
0.4
0.352
0.35
0.3
0.262
0.25
0.2
0.15
0.124
0.096
0.1
0.047 0.054
0.05
0.018 0.020 0.016 0.011
8 9 10
5 6 7
0 1
2 3
4
Child Number
(a) What is the probability that a randomly selected 50- to
54-year-old mother who had a live birth in 2013 has had her
fourth live birth?
(b) What is the probability that a randomly selected 50- to
54-year-old mother who had a live birth in 2013 has had her
fourth or fifth live birth?
(c) What is the probability that a randomly selected 50- to
54-year-old mother who had a live birth in 2013 has had her
sixth or more live birth?
Probability
Expert Solution
This question has been solved!
Explore an expertly crafted, step-by-step solution for a thorough understanding of key concepts.

This is a popular solution!

Trending now
This is a popular solution!

Step by step
Solved in 4 steps with 2 images

Recommended textbooks for you
College Algebra
Algebra
ISBN:
9781305115545
Author:
James Stewart, Lothar Redlin, Saleem Watson
Publisher:
Cengage Learning
College Algebra
Algebra
ISBN:
9781305115545
Author:
James Stewart, Lothar Redlin, Saleem Watson
Publisher:
Cengage Learning