
Algebra and Trigonometry (6th Edition)
6th Edition
ISBN:9780134463216
Author:Robert F. Blitzer
Publisher:Robert F. Blitzer
ChapterP: Prerequisites: Fundamental Concepts Of Algebra
Section: Chapter Questions
Problem 1MCCP: In Exercises 1-25, simplify the given expression or perform the indicated operation (and simplify,...

Related questions
Question
Transcribed Image Text:Design
Layout
References
Mailings
Review
>>
Tell me
e Sha
(H. v
12
A A Aa v
Ap
v ab
A
• O v A v
Paragraph
Styles
Dictate
Sensitivity
En
3.
14
6.
7.
9.
10
11
12
13
14
15
16
17
18
Magnitude of the DFT for L12 and Na12
Magnitude of the DFT for Lad12 and Ned12
35
30
15
15
10
10
02
04
06
02
Normaled trequencyxpi
Normalaed tequency x pi
Magnitude of the DFT for Ls12 and NS12
Magnitude of the DFT for Las12 and Nus12
140
120
100
16
10
20
02
06
Nomaled tequncy x p
04
02
04
08
Normalred hequency x pl
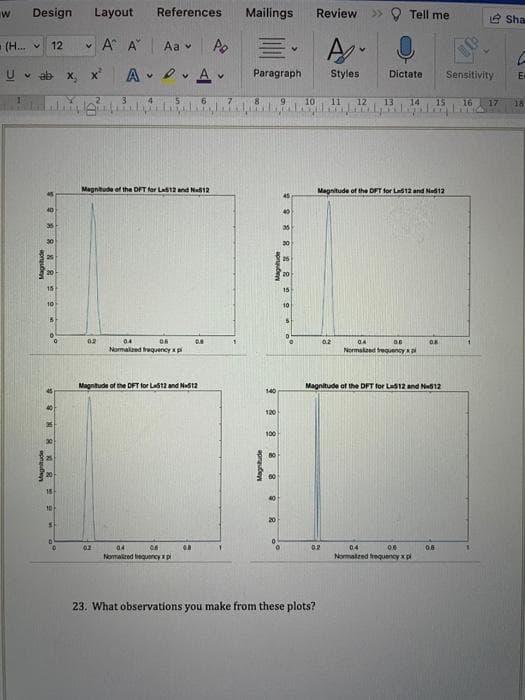
23. What observations you make from these plots?
Magnitude
apnuly
aprqute
Magnihude
Expert Solution
This question has been solved!
Explore an expertly crafted, step-by-step solution for a thorough understanding of key concepts.

Step by step
Solved in 2 steps

Recommended textbooks for you
Algebra and Trigonometry (6th Edition)
Algebra
ISBN:
9780134463216
Author:
Robert F. Blitzer
Publisher:
PEARSON

Contemporary Abstract Algebra
Algebra
ISBN:
9781305657960
Author:
Joseph Gallian
Publisher:
Cengage Learning

Linear Algebra: A Modern Introduction
Algebra
ISBN:
9781285463247
Author:
David Poole
Publisher:
Cengage Learning
Algebra and Trigonometry (6th Edition)
Algebra
ISBN:
9780134463216
Author:
Robert F. Blitzer
Publisher:
PEARSON
Contemporary Abstract Algebra
Algebra
ISBN:
9781305657960
Author:
Joseph Gallian
Publisher:
Cengage Learning
Linear Algebra: A Modern Introduction
Algebra
ISBN:
9781285463247
Author:
David Poole
Publisher:
Cengage Learning

Algebra And Trigonometry (11th Edition)
Algebra
ISBN:
9780135163078
Author:
Michael Sullivan
Publisher:
PEARSON

Introduction to Linear Algebra, Fifth Edition
Algebra
ISBN:
9780980232776
Author:
Gilbert Strang
Publisher:
Wellesley-Cambridge Press

College Algebra (Collegiate Math)
Algebra
ISBN:
9780077836344
Author:
Julie Miller, Donna Gerken
Publisher:
McGraw-Hill Education