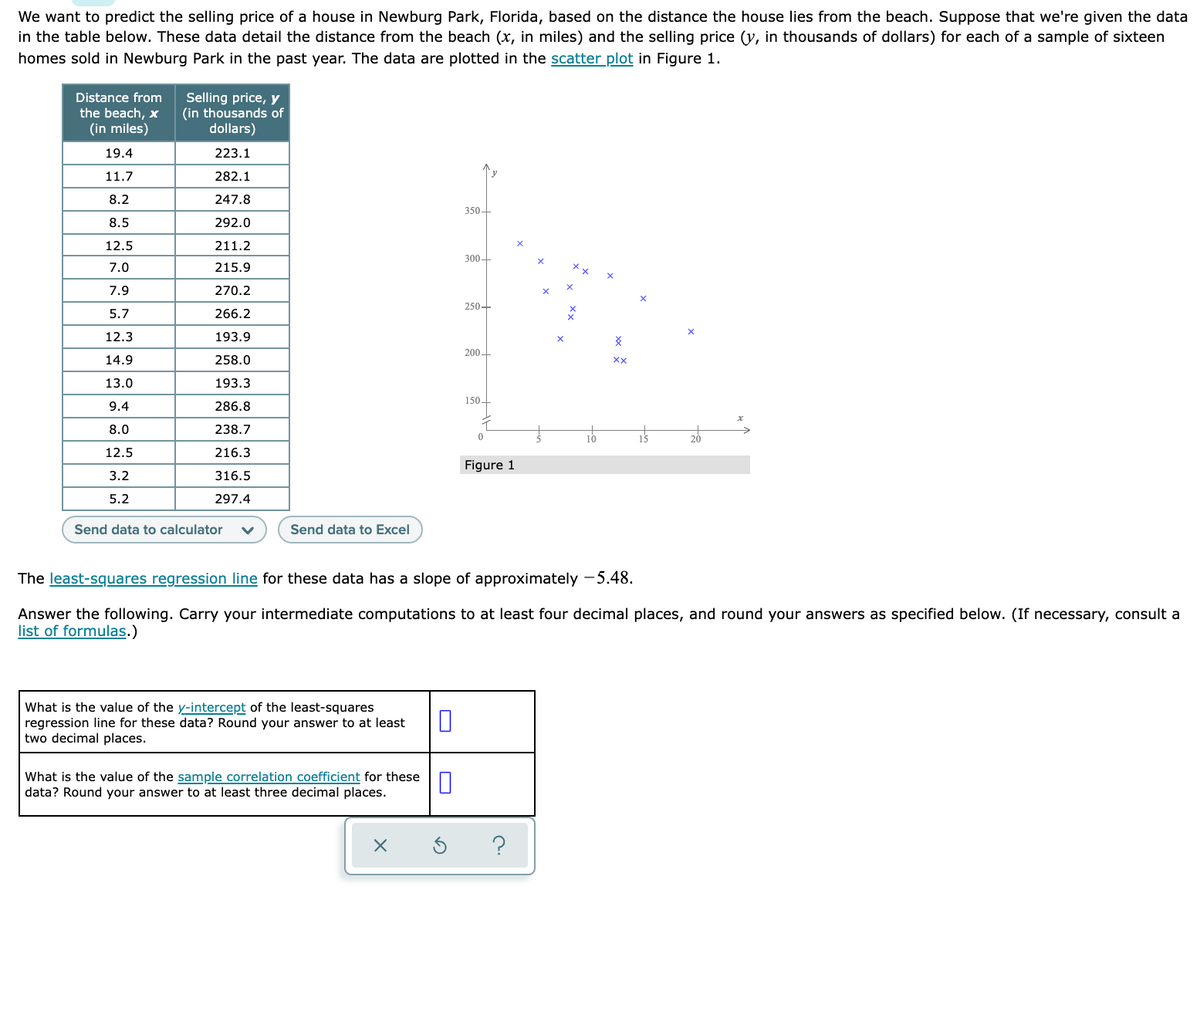
We want to predict the selling price of a house in Newburg Park, Florida, based on the distance the house lies from the beach. Suppose that we're given the data in the table below. These data detail the distance from the beach (x, in miles) and the selling price (y, in thousands of dollars) for each of a sample of sixteen homes sold in Newburg Park in the past year. The data are plotted in the scatter plot in Figure 1. Distance from the beach, x (in miles) Selling price, y (in thousands of dollars) 19.4 223.1 11.7 282.1 8.2 247.8 350- 8.5 292.0 12.5 211.2 300- 7.0 215.9 7.9 270.2 250- 5.7 266.2 12.3 193.9 14.9 258.0 13.0 193.3 150- 9.4 286.8 8.0 238.7 20 12.5 216.3 Figure 1 3.2 316.5 5.2 297.4 Send data to calculator Send data to Excel The least-squares regression line for these data has a slope of approximately –5.48. Answer the following. Carry your intermediate computations to at least four decimal places, and round your answers as specified below. (If necessary, consult a list of formulas.) What is the value of the y-intercept of the least-squares regression line for these data? Round your answer to at least two decimal places. What is the value of the sample correlation coefficient for these data? Round your answer to at least three decimal places.
We want to predict the selling price of a house in Newburg Park, Florida, based on the distance the house lies from the beach. Suppose that we're given the data in the table below. These data detail the distance from the beach (x, in miles) and the selling price (y, in thousands of dollars) for each of a sample of sixteen homes sold in Newburg Park in the past year. The data are plotted in the scatter plot in Figure 1. Distance from the beach, x (in miles) Selling price, y (in thousands of dollars) 19.4 223.1 11.7 282.1 8.2 247.8 350- 8.5 292.0 12.5 211.2 300- 7.0 215.9 7.9 270.2 250- 5.7 266.2 12.3 193.9 14.9 258.0 13.0 193.3 150- 9.4 286.8 8.0 238.7 20 12.5 216.3 Figure 1 3.2 316.5 5.2 297.4 Send data to calculator Send data to Excel The least-squares regression line for these data has a slope of approximately –5.48. Answer the following. Carry your intermediate computations to at least four decimal places, and round your answers as specified below. (If necessary, consult a list of formulas.) What is the value of the y-intercept of the least-squares regression line for these data? Round your answer to at least two decimal places. What is the value of the sample correlation coefficient for these data? Round your answer to at least three decimal places.

Algebra & Trigonometry with Analytic Geometry
13th Edition
ISBN:9781133382119
Author:Swokowski
Publisher:Swokowski
Chapter7: Analytic Trigonometry
Section7.6: The Inverse Trigonometric Functions
Problem 94E

Related questions
Question
Transcribed Image Text:We want to predict the selling price of a house in Newburg Park, Florida, based on the distance the house lies from the beach. Suppose that we're given the data
in the table below. These data detail the distance from the beach (x, in miles) and the selling price (y, in thousands of dollars) for each of a sample of sixteen
homes sold in Newburg Park in the past year. The data are plotted in the scatter plot in Figure 1.
Selling price, y
(in thousands of
dollars)
Distance from
the beach, x
(in miles)
19.4
223.1
11.7
282.1
8.2
247.8
350-
8.5
292.0
12.5
211.2
300-
7.0
215.9
7.9
270.2
250-
5.7
266.2
12.3
193.9
200-
14.9
258.0
13.0
193.3
150-
9.4
286.8
8.0
238.7
10
20
12.5
216.3
Figure 1
3.2
316.5
5.2
297.4
Send data to calculator
Send data to Excel
The least-squares regression line for these data has a slope of approximately -5.48.
Answer the following. Carry your intermediate computations to at least four decimal places, and round your answers as specified below. (If necessary, consult a
list of formulas.)
What is the value of the y-intercept of the least-squares
regression line for these data? Round your answer to at least
two decimal places.
What is the value of the sample correlation coefficient for these
data? Round your answer to at least three decimal places.
Expert Solution
This question has been solved!
Explore an expertly crafted, step-by-step solution for a thorough understanding of key concepts.

This is a popular solution!

Trending now
This is a popular solution!

Step by step
Solved in 5 steps with 5 images

Recommended textbooks for you
Algebra & Trigonometry with Analytic Geometry
Algebra
ISBN:
9781133382119
Author:
Swokowski
Publisher:
Cengage


Trigonometry (MindTap Course List)
Trigonometry
ISBN:
9781337278461
Author:
Ron Larson
Publisher:
Cengage Learning
Algebra & Trigonometry with Analytic Geometry
Algebra
ISBN:
9781133382119
Author:
Swokowski
Publisher:
Cengage
Trigonometry (MindTap Course List)
Trigonometry
ISBN:
9781337278461
Author:
Ron Larson
Publisher:
Cengage Learning

Glencoe Algebra 1, Student Edition, 9780079039897…
Algebra
ISBN:
9780079039897
Author:
Carter
Publisher:
McGraw Hill

Functions and Change: A Modeling Approach to Coll…
Algebra
ISBN:
9781337111348
Author:
Bruce Crauder, Benny Evans, Alan Noell
Publisher:
Cengage Learning

Holt Mcdougal Larson Pre-algebra: Student Edition…
Algebra
ISBN:
9780547587776
Author:
HOLT MCDOUGAL
Publisher:
HOLT MCDOUGAL