25 20 Food to In the diagram, the slope of the curve is increasing at a constant rate. increasing at a decreasing rate. decreasing at a constant rate. decreasing at an increasing rate.
25 20 Food to In the diagram, the slope of the curve is increasing at a constant rate. increasing at a decreasing rate. decreasing at a constant rate. decreasing at an increasing rate.

Chapter1: Introducing The Economic Way Of Thinking
Section1.A: Applying Graphs To Economics
Problem 17SQ

Related questions
Question
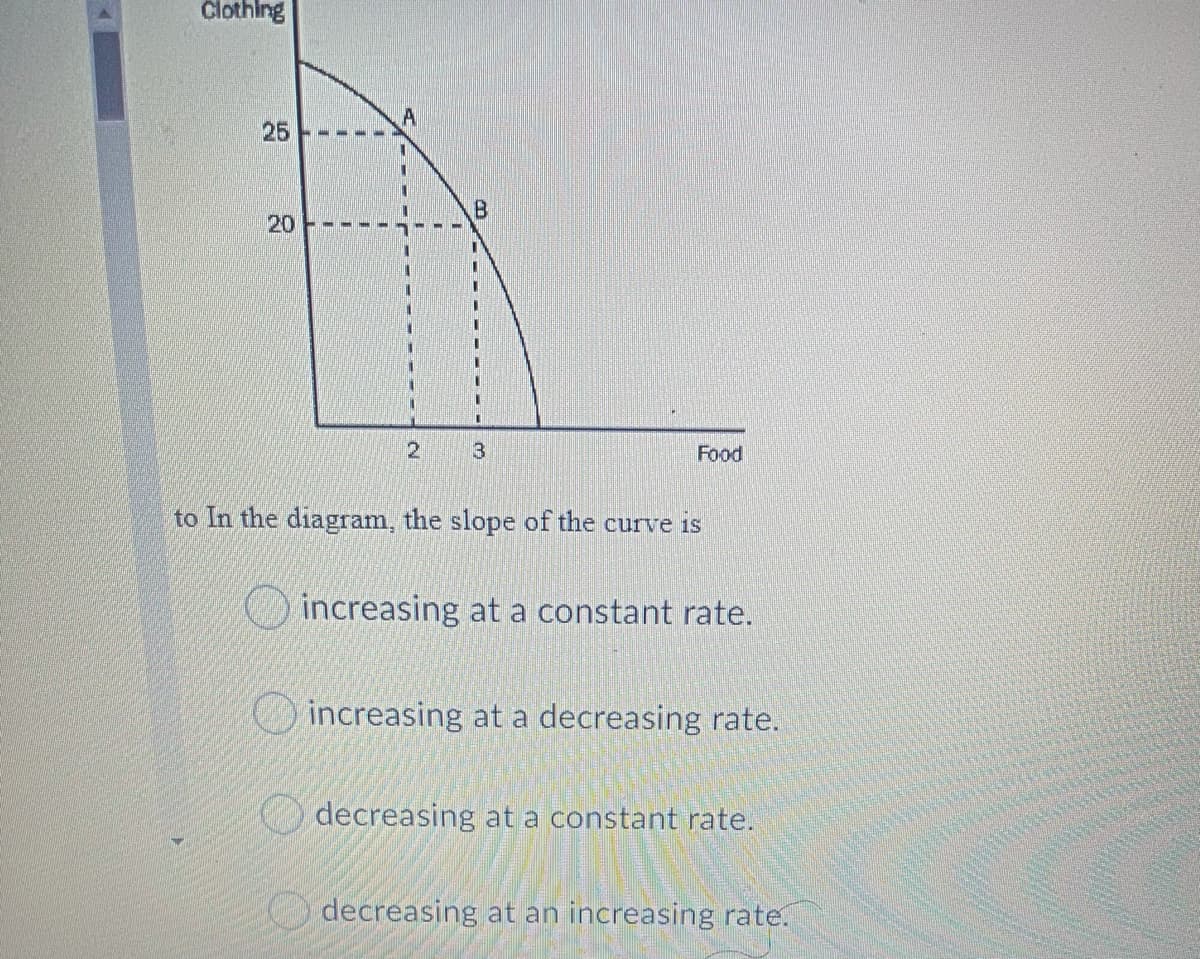
Transcribed Image Text:Clothing
A
25
20
12
13
Food
to In the diagram, the slope of the curve is
increasing at a constant rate.
increasing at a decreasing rate.
decreasing at a constant rate.
decreasing at an increasing rate.
Expert Solution
This question has been solved!
Explore an expertly crafted, step-by-step solution for a thorough understanding of key concepts.

Step by step
Solved in 2 steps

Recommended textbooks for you


Principles of Economics 2e
Economics
ISBN:
9781947172364
Author:
Steven A. Greenlaw; David Shapiro
Publisher:
OpenStax
