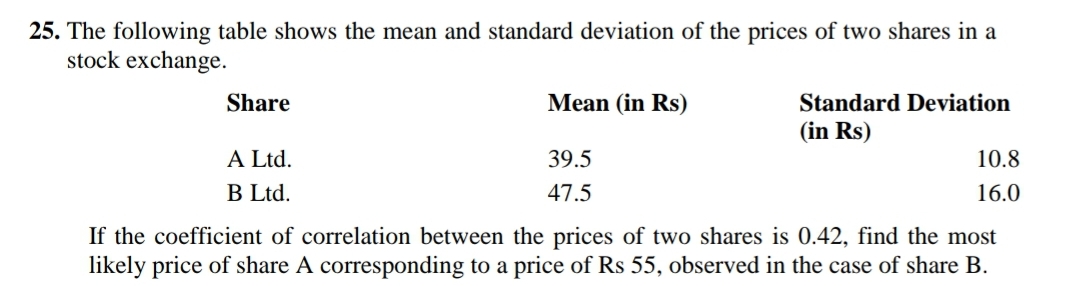
25. The following table shows the mean and standard deviation of the prices of two shares in a stock exchange. Share Mean (in Rs) Standard Deviation (in Rs) A Ltd. 10.8 39.5 47.5 B Ltd. 16.0 If the coefficient of correlation between the prices of two shares is 0.42, find the most likely price of share A corresponding to a price of Rs 55, observed in the case of share B.
25. The following table shows the mean and standard deviation of the prices of two shares in a stock exchange. Share Mean (in Rs) Standard Deviation (in Rs) A Ltd. 10.8 39.5 47.5 B Ltd. 16.0 If the coefficient of correlation between the prices of two shares is 0.42, find the most likely price of share A corresponding to a price of Rs 55, observed in the case of share B.

Glencoe Algebra 1, Student Edition, 9780079039897, 0079039898, 2018
18th Edition
ISBN:9780079039897
Author:Carter
Publisher:Carter
Chapter10: Statistics
Section10.4: Distributions Of Data
Problem 19PFA

Related questions
Question
Transcribed Image Text:25. The following table shows the mean and standard deviation of the prices of two shares in a
stock exchange.
Share
Mean (in Rs)
Standard Deviation
(in Rs)
A Ltd.
B Ltd.
39.5
10.8
47.5
16.0
If the coefficient of correlation between the prices of two shares is 0.42, find the most
likely price of share A corresponding to a price of Rs 55, observed in the case of share B.
Expert Solution
This question has been solved!
Explore an expertly crafted, step-by-step solution for a thorough understanding of key concepts.

Step by step
Solved in 2 steps with 1 images

Recommended textbooks for you
Glencoe Algebra 1, Student Edition, 9780079039897…
Algebra
ISBN:
9780079039897
Author:
Carter
Publisher:
McGraw Hill
Glencoe Algebra 1, Student Edition, 9780079039897…
Algebra
ISBN:
9780079039897
Author:
Carter
Publisher:
McGraw Hill