The price to earnings ratio (P/E) is an important tool in financial work. A random sample of 14 large U.S. banks (J. P. Morgan, Bank of America, and others) gave the following P/E ratios.†
| 24 |
16 |
22 |
14 |
12 |
13 |
17 |
22 |
15 |
19 |
23 |
13 |
11 |
18 |
The sample mean is
x ≈ 17.1.
Generally speaking, a low P/E ratio indicates a "value" or bargain stock. Suppose a recent copy of a magazine indicated that the P/E ratio of a certain stock index is μ = 18. Let x be a random variable representing the P/E ratio of all large U.S. bank stocks. We assume that x has a normal distribution and σ = 4.4. Do these data indicate that the P/E ratio of all U.S. bank stocks is less than 18? Use α = 0.05.
(a) State the null and alternate hypotheses. Will you use a left-tailed, right-tailed, or two-tailed test?
a) H0: μ = 18; H1: μ > 18; right-tailed
b) H0: μ = 18; H1: μ < 18; left-tailed
c) H0: μ ≠ 18; H1: μ = 18; two-tailed
d) H0: μ = 18; H1: μ ≠ 18; two-tailed
(b) What sampling distribution will you use? Explain the rationale for your choice of sampling distribution.
a) The Student's t, since we assume that x has a normal distribution with known σ.
b) The Student's t, since n is large with unknown σ.
c) The standard normal, since we assume that x has a normal distribution with unknown σ.
d) The standard normal, since we assume that x has a normal distribution with known σ.
Compute the
z value of the sample test statistic. (Round your answer to two decimal places.)
(c) Find (or estimate) the
P-value. (Round your answer to four decimal places.)
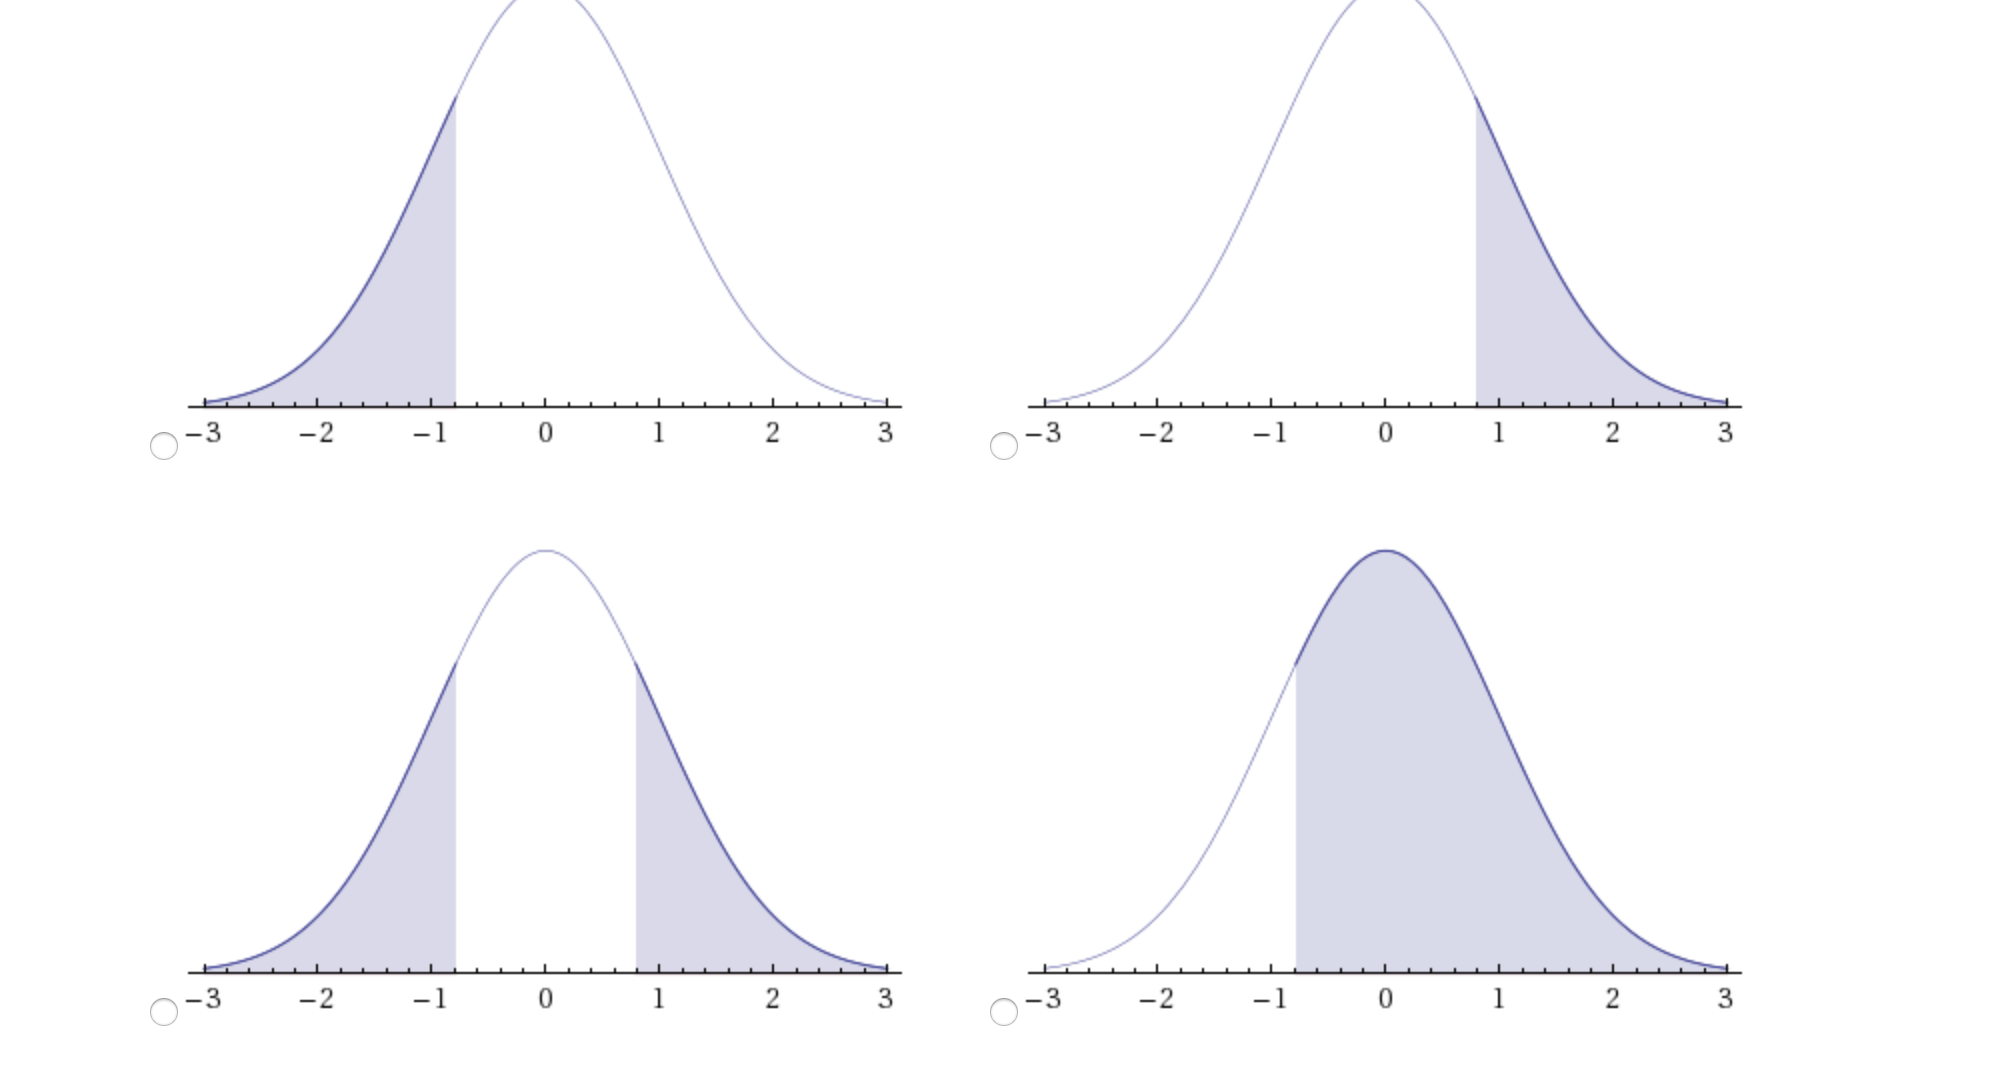
Sketch the sampling distribution and show the area corresponding to the
P-value.
(d) Based on your answers in parts (a) to (c), will you reject or fail to reject the null hypothesis? Are the data statistically significant at level α?
a) At the α = 0.05 level, we reject the null hypothesis and conclude the data are statistically significant.
b) At the α = 0.05 level, we reject the null hypothesis and conclude the data are not statistically significant.
c) At the α = 0.05 level, we fail to reject the null hypothesis and conclude the data are statistically significant.
d) At the α = 0.05 level, we fail to reject the null hypothesis and conclude the data are not statistically significant.