(3) Create the function which best describes the graph show below. f(x)_8 3 2 -7 -6 -5 -4 -3 -2 -1 0 10 11 -1 CO 4. 7. 5, 4,
(3) Create the function which best describes the graph show below. f(x)_8 3 2 -7 -6 -5 -4 -3 -2 -1 0 10 11 -1 CO 4. 7. 5, 4,

Algebra & Trigonometry with Analytic Geometry
13th Edition
ISBN:9781133382119
Author:Swokowski
Publisher:Swokowski
Chapter5: Inverse, Exponential, And Logarithmic Functions
Section5.2: Exponential Functions
Problem 20E

Related questions

Question
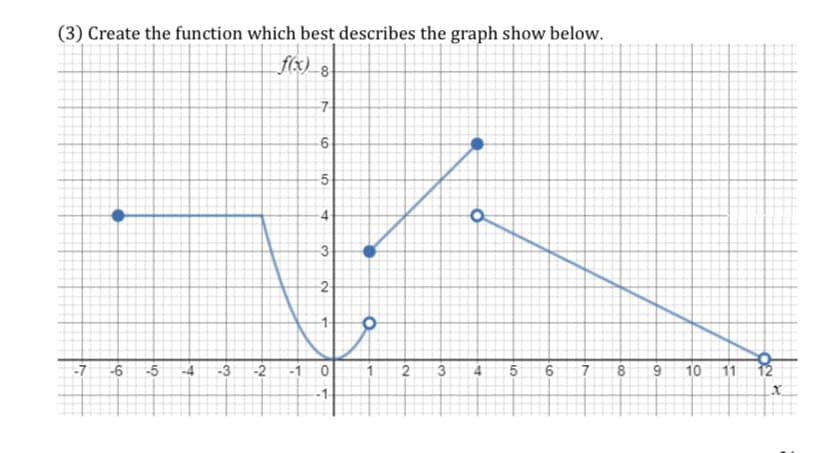
Transcribed Image Text:(3) Create the function which best describes the graph show below.
f(x) 8
2-
-7
-6
-5
-4
-3
-1 0
2
5
8
10
11
-1
4.
7.
5,
4,
3.
2.
Expert Solution
This question has been solved!
Explore an expertly crafted, step-by-step solution for a thorough understanding of key concepts.

This is a popular solution!

Trending now
This is a popular solution!

Step by step
Solved in 4 steps with 3 images

Knowledge Booster


Learn more about
Need a deep-dive on the concept behind this application? Look no further. Learn more about this topic, advanced-math and related others by exploring similar questions and additional content below.Recommended textbooks for you
Algebra & Trigonometry with Analytic Geometry
Algebra
ISBN:
9781133382119
Author:
Swokowski
Publisher:
Cengage
Algebra & Trigonometry with Analytic Geometry
Algebra
ISBN:
9781133382119
Author:
Swokowski
Publisher:
Cengage