3 Describe the correlations between the variables in these graphs in terms of: i direction (positive or negative) ii shape (linear or non-linear) iii strength (strong, moderate, weak or none) a 800 8700 Price Temperature (degrees Fahrenheit) 1100 1000- 900 Births 600- 500 400 300- 200- 0.10 0.15 0.20 0.25 0.30 0.35 Size in carats 75- 70- 8 65- 15 ... 25 30 35 Number of chirps in 15 seconds : Women's age £5 b 600 500- 2 400- Max distance to read sign City MPG Number of people 50- 20- 10- 250 200 150 100 15 25 35 45 $ 66 5 Scatterplot of city MPG vs hwy MPG 20 25 30 35 40 Hwy MPG 4 8 6 Month 10 12
3 Describe the correlations between the variables in these graphs in terms of: i direction (positive or negative) ii shape (linear or non-linear) iii strength (strong, moderate, weak or none) a 800 8700 Price Temperature (degrees Fahrenheit) 1100 1000- 900 Births 600- 500 400 300- 200- 0.10 0.15 0.20 0.25 0.30 0.35 Size in carats 75- 70- 8 65- 15 ... 25 30 35 Number of chirps in 15 seconds : Women's age £5 b 600 500- 2 400- Max distance to read sign City MPG Number of people 50- 20- 10- 250 200 150 100 15 25 35 45 $ 66 5 Scatterplot of city MPG vs hwy MPG 20 25 30 35 40 Hwy MPG 4 8 6 Month 10 12

Glencoe Algebra 1, Student Edition, 9780079039897, 0079039898, 2018
18th Edition
ISBN:9780079039897
Author:Carter
Publisher:Carter
Chapter4: Equations Of Linear Functions
Section4.4: Scatter Plots And Line Of Fit
Problem 1CYU

Related questions
Question
Plz tell me a little more detail
Answer all parts and plz don't copy from other work
Transcribed Image Text:Page 4
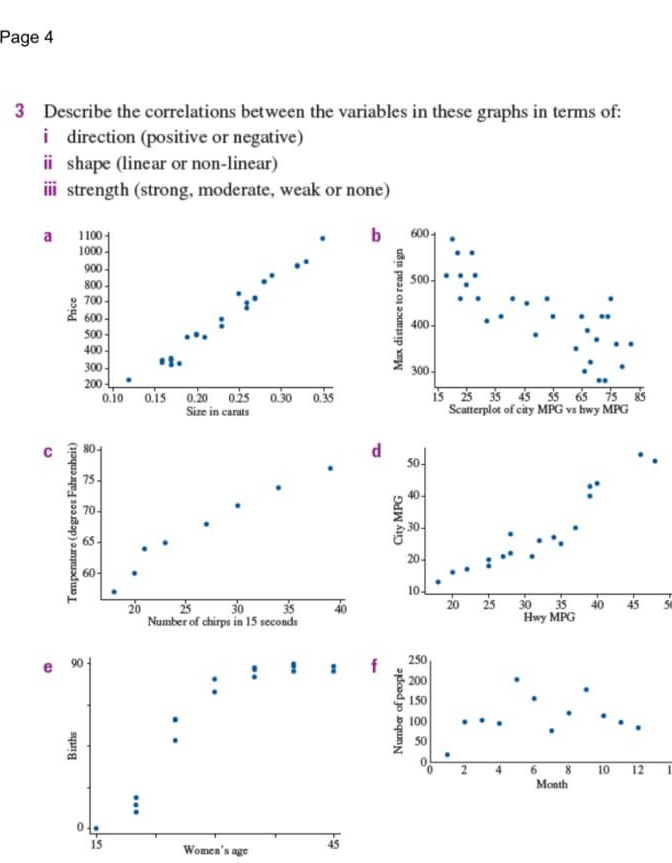
3 Describe the correlations between the variables in these graphs in terms of:
i direction (positive or negative)
ii shape (linear or non-linear)
iii strength (strong, moderate, weak or none)
a
Tamperature (degrees Fahrenheit)
11001
1000-
8 700
Births
900-
800-
8
600-
500-
400-
300
200-L
0.10 0.15 0.20 0.25 0.30
Size in carats
75.
15
20
...
25 30 35
Number of chirps in 15 seconds
Women's age
0.35
5
b
Max distance to read sign
City MPG
Number of people
600-
500-
400-
40-
20-
10-
250
200
150
100
50
15 25 35 45 5 5 5
Scatterplot of city MPG vs hwy MPG
20 25
4
30 35
Hwy MPG
6
Month
10
12
Expert Solution
This question has been solved!
Explore an expertly crafted, step-by-step solution for a thorough understanding of key concepts.

Step by step
Solved in 4 steps

Recommended textbooks for you
Glencoe Algebra 1, Student Edition, 9780079039897…
Algebra
ISBN:
9780079039897
Author:
Carter
Publisher:
McGraw Hill

Big Ideas Math A Bridge To Success Algebra 1: Stu…
Algebra
ISBN:
9781680331141
Author:
HOUGHTON MIFFLIN HARCOURT
Publisher:
Houghton Mifflin Harcourt

Glencoe Algebra 1, Student Edition, 9780079039897…
Algebra
ISBN:
9780079039897
Author:
Carter
Publisher:
McGraw Hill
Big Ideas Math A Bridge To Success Algebra 1: Stu…
Algebra
ISBN:
9781680331141
Author:
HOUGHTON MIFFLIN HARCOURT
Publisher:
Houghton Mifflin Harcourt

Algebra & Trigonometry with Analytic Geometry
Algebra
ISBN:
9781133382119
Author:
Swokowski
Publisher:
Cengage