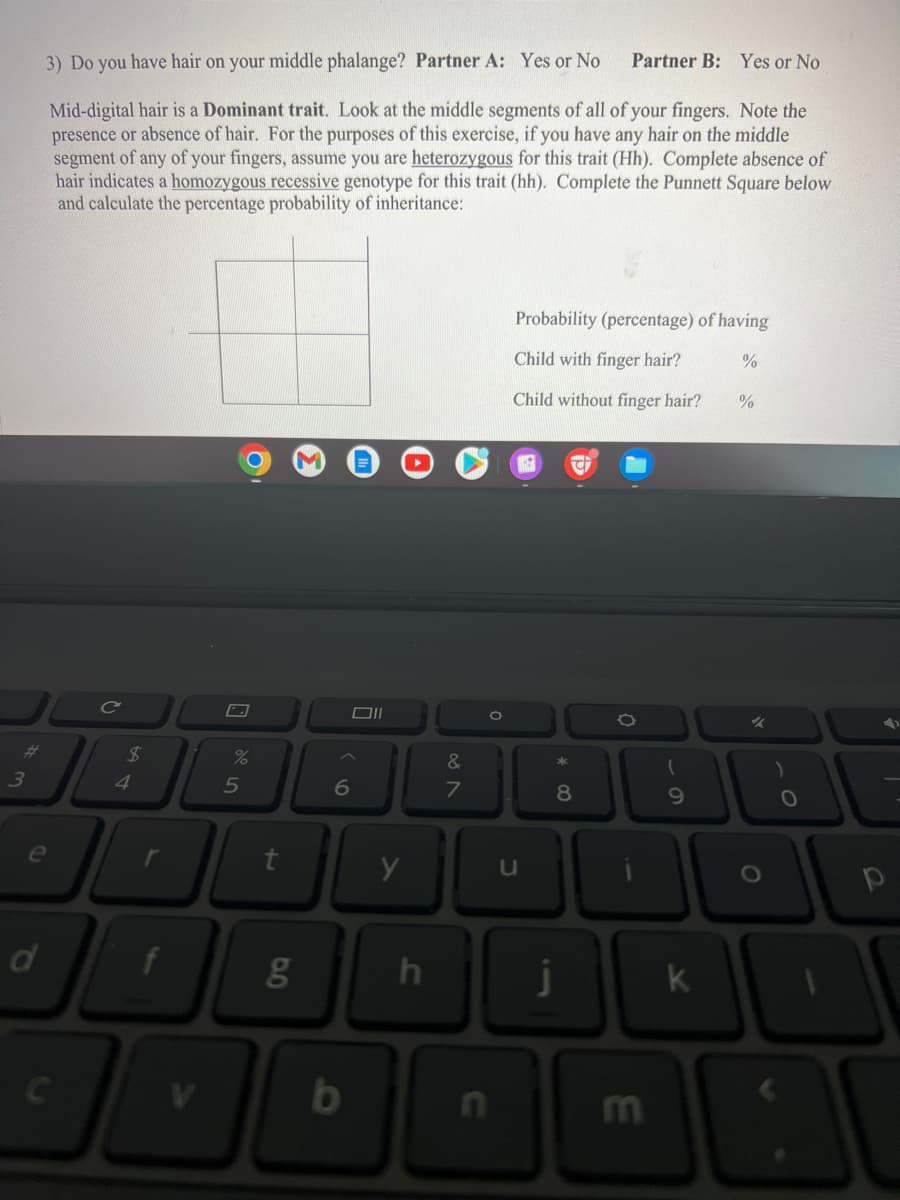
3) Do you have hair on your middle phalange? Partner A: Yes or No Mid-digital hair is a Dominant trait. Look at the middle segments of all of your fingers. Note the presence or absence of hair. For the purposes of this exercise, if you have any hair on the middle segment of any of your fingers, assume you are heterozygous for this trait (Hh). Complete absence of hair indicates a homozygous recessive genotype for this trait (hh). Complete the Punnett Square below and calculate the percentage probability of inheritance: Partner B: Yes or No Probability (percentage) of having Child with finger hair? % Child without finger hair? %
Q: 5 10 + 15 20 25 30 data Number 40 24 42 10 16 35 40 45 Based on the box plot above, determine which…
A:
Q: Use correlation coefficients to determine which of the given sets of data is best fit by its…
A: Given: Dataset 1 x y -1 1 0 2 3 4 Dataset 2 x y -2 -3 0 -1 1 2 Dataset 3…
Q: banker finds that the number of times people use automated-teller machines (ATMs) in a year are…
A: We have given Mean(µ) = 40Standard deviations (σ) = 11.2X ~ N (µ, σ )= N(40, 11.2)
Q: Home Sales Prices (hundred thousands) (ten thousands) 0 667778999 1 02447778889999 2…
A: Given that Home Sales Prices (hundred thousands) (ten thousands) 0 667778999 1…
Q: (f) P(A and C) = 0.069
A: Given that A B C Total Male 6 30 11 47 Female 19 16 15 50 Total 25 46 26 97
Q: Let X be a random variable which represents the lifetime in years of a particular battery. We are…
A: Since you have posted a question with multiple subparts, we will solve first 3 sub-parts for you. To…
Q: following data represent the weights (in grams) of a simple random sample of a candy. 0.92 0.90 0.89…
A: The given data is; 0.92,0.90,0.89,0.93,0.92,0.86,0.93,0.87,0.81,0.90
Q: of people have type O or Rh- factor. Round all decimals to 4 places where possible. (a) Find the…
A: Given that P(Type O) = 38% = 0.38 P(Rh-Factor) = 10% = 0.10 P(Type O or Rh-factor) = 46% = 0.46
Q: -1 0 Z-distribution =130 (approximately) 1 ABC 2 3 Consider the figure above. A scientist tried…
A: Given Sample size 3,5,20
Q: The accompanying data represent the pulse rates (beats per minute) of nine students. Treat the nine…
A: The data shows the pulse rates of nine students.
Q: The following table summarizes 204 endothermic reactions involving sodium bicarbonate. Final…
A: Data is given for temperature Absorb heat( below target, above target) We have to answer for…
Q: X only if Y expresses that Y is a necessary condition for X X is a necessary condition for Y X is…
A: X only if y It means X can occur only if y has occured. X can happen only when we have y.
Q: an example of a discrete quantitative ent grade point average e spent preparing for SAT
A: A variable can be used to characterize a individual quantitative or qualitative characteristics.…
Q: What is that spread? Which interval has the most data in it? 35 - 47 47 - 58 58 - 69 19 - 37 What…
A: Answer: 1. Spread: It measure of how far the data ranges from the center of data. Here Minimum…
Q: (g) A OR B = 6 (1) P(A AND B) = 0.6 (1) P(A OR B) = 0.6 A'= 5
A: We have given that Sample space (S) = {3,6,9,12,15,18,21,24,27,30} => number of elements in S…
Q: An experiment investigated the effect of length and repetition of TV ads on students choosing to eat…
A: Total students = 60 All watched 40 minutes television program Two types of ads( 30sec & 90…
Q: amount of time, in minutes, that a woman must wait for a cab is uniformly distributed between zero…
A: Let X be the amount of time, in minutes, that a woman must wait for a cab is uniformly distribution…
Q: Below is a contingency table of data regarding NFL quarterbacks from the 2017 season. One variable…
A: Given that Total = n = 30 Quarterbacks makes more than 10 million dollars annually = A = 17
Q: Answer D ONLY
A: Required: To identify the similarities and differences between the two distributions.
Q: The data below shows the number jobs that a sample of people had in their life time: 6 99 10 12 12…
A: Since you have posted a question with multiple sub-parts, we will solve first three sub- parts for…
Q: (i) P(A OR B) = ()A'= (k) P(A')= (1) P(A) + P(A¹') = (m) P(AB)= (n) P(BA) =
A: Given S= { 3,6,9,....30} Now, N= 10 Event (A) = Even numbers. Event (B)= greater than 25 We have to…
Q: Which of the following sentences is the correct interpretation of the slope? For every one unit…
A: The regression equation is given by MPG = 37.49079 - 4.357743 Displacement
Q: Estimate p-value using the following randomization distribution for a correlation between two…
A:
Q: The mean household income in the US in 2019 was about $89,930 and the standard deviation was about…
A: The random variable follows normal distribution, then the z score is calculated using the mean and…
Q: a. Find the mean, μ = b. Find the standard deviation, σ =
A: Given: A train arrives every eight minutes. The length of time follows uniform distribution.
Q: K The ages of a group of 126 randomly selected adult females have a standard deviation of 17.2…
A: We have given Standard deviation(σ) = 17.2Margin of error (E) = 1/2 = 0.5Significance level (α) = 1…
Q: Studies are often done by pharmaceutical companies to determine the effectiveness of a treatment…
A: Since you have posted a question with multiple subparts, we will solve first three subparts for you.…
Q: a. Σχy, i=1 b. Σ(x)(y) C. (Σ' (Σ'
A: Since you have asked multiple questions, we will solve the first question for you. If you want any…
Q: Ridge and Lasso regression are two methods for estimating the parameter vector of a linear…
A: In Ridge and Lasso Regression, we have a penalty parameter also known as Tuning parameter λ whose…
Q: 6) The probability distribution of a random variable D is the density curve of a uniform…
A: Given X~Uniform(0.2,0.7) Result: When X~U(a,b) then f(x)=1/(b-a) a<x<b And CDF will be…
Q: How many quarterbacks have a QBR greater than 60, but earn less than 10 million dollars annually? 6
A: It is given that Total = 36 Variables : Salary, QBR
Q: The data given to the right includes data from 36 candies, and 8 of them are red. The company that…
A: We have given thatn = 36x = 8p̂ = x/n = 8/36 = 0.222Significance level (α) = 1 - 0.90 = 0.10
Q: Office of Coal, Nuclear, Electric and Alternate Fuels reported the owing data as the costs (in…
A: Hi! Thank you for the question, As per the honor code, we are allowed to answer three sub-parts at a…
Q: Table 2.30 Frequency Distribution of Family Incomes 2.29 Family Income, S 10,000-11,999…
A: We have to make the following table to compute mean, median and mode Class Frequency (f) Mid…
Q: Identify the following measures as either quantitative or qualitative: a. The genders of the first…
A: The variable, which is essentially measured through a nominal scale is described as a qualitative…
Q: A candy bar manufacturer is interested in trying to estimate how sales are influenced by the price…
A: Correlation is the measure of association between the two numerical variable. Correlation is denoted…
Q: Determine the probability that a random woman in the age range of 18 to 50 has a shoe size between…
A: It is given that Mean, μ = 8.43 Standard deviation, σ = 1.35 Z-Score, Z = ( X - μ )/σ
Q: The brain volumes (cm^3) of 20 brains have a mean of 1128.8 cm^3 and a standard deviation of 129.3…
A: Formula : significantly low value=μ - 2*σ
Q: Using the table below: a) Construct an expanded table showing relative return b) Calculate the…
A: The returns for 8 weeks with corresponding probabilities are given in the table below: Week…
Q: The following data represent the amount of time (in minutes) a random sample of eight students took…
A:
Q: (a) Determine the population mean pulse. The population mean pulse is approximately (Round to one…
A: Given: Population size, N=9 Student Pulse Perceptual Bempah 86 Megan Brooks 73 Jeff…
Q: Express the confidence interval 0.444 <p<0.888 in the form p±E. p±E= ±
A: given data ci for proportion : 0.444<p<0.888 find this ci in p⏞ ±E form
Q: 3.57 Consider the experiment depicted by the Venn diagram, with the sample space S containing five…
A: Given: P(E1) =0.20 P(E2 )=0.30 P(E3)=0.30 P(E4)=0.10 P(E5)=0.10
Q: True or False: The closer the correlation coefficient, r, is to zero, the weaker the linear…
A: We have to interpret the values of correlation coefficient r
Q: Example 12. Draw a histogram, frequency polygram and frequency curve representing the following…
A:
Q: The following are ages in years of nine employees of a large company. 46, 22, 35, 26, 22, 53, 33,…
A: The question is about measures Given : Data : 46, 22, 35, 26, 22, 53, 33, 42, 59 To find : Mean…
Q: 60 randomly selected students were asked the number of pairs of shoes they have. Let X represent the…
A: Since you have posted a question with multiple subparts, we will solve first three subparts for you.…
Q: find the five number summary for the data by hand.
A: It is given that the stem and leaf plot of the data. Here, need to find out the five number summary…
Q: Question: If we have two independent samples of size n and size m and want to test if the sample…
A: It is given that we have two independent samples of size n and size m.
Q: In the library on a university campus, there is a sign in the elevator that indicates a limit of 16…
A: Note: Hi! Thank you for your question. As per the guideline, we can solve three subparts at a time…
Step by step
Solved in 2 steps
- The flowers of 4 o’clock plants may be red, pink or white. Reds crossed to whites only produced pink offspring. When pink flowered plants were crossed with each other, they produced 113 red, 129 white, and 242 pink. It is hypothesized that these colors are controlled by a single gene pair of incompletely dominant alleles. Is this hypothesis acceptable on the basis of a Chi-square test? Show your solutions below.1. The data are generated from an initial parental cross. One parent displays the disease phenotype and one displays the wild-type (WT) phenotype. The WT parent always has a homozygous genotype. Your task is to perform a chi-square goodness of fit test on each of two F2 data sets, and make a decision, based on your statistical analyses as to which F2 data set provides greater evidence for indicating the correct mode of inheritance. In this problem, the true mode of inheritance is autosomal dominant, homozygous lethal. Evidence is measured in the following ways: the p-value is greater than 0.05, so we do not reject the null hypothesis, and the p-value is closer to 1. A few things of which to be mindful. 1. In the parental generation, the WT parent always has a homozygous genotype. 2. For the autosomal dominant mode of inheritance, the disease gene always homozygous for the disease allele in the parental generation. 3. For the autosomal dominant, homozygous lethal any person with the…A geneticist working on peas has a single plant monohybrid Y/y (yellow) plant and, from a self of this plant,wants to produce a plant of genotype y/y to use as a tester. How many progeny plants need to be grown to be 95percent sure of obtaining at least one in the sample?
- Are you an impulse shopper? A survey of 1000 grocery shoppers indicated that 24% of males and 57%of females make an impulse purchase every time they shop. Assume that the survey consisted of 500 males and 500 females. Complete parts (a) and (b) below. Question content area bottom Part 1 a. At the 0.01 level of significance, is there evidence of a difference in the proportion of males and females who make an impulse purchase every time they shop? Let group 1 be the males, and let group 2 be the females. State the null and alternative hypotheses. Choose the correct answer below. A. H0:π1≥π2 H1:π1<π2 BH0:π1≠π2 H1:π1=π2 C.H0:π1≤π2 H1:π1>π2 D.H0:π1=π2 H1:π1≠π2 E.H0:π1<π2 H1:π1≥π2 F.H0:π1>π2 H1:π1≤π2 Part 2 Calculate the test statistic. χ2STAT= (Round to three decimal places as needed.) Part 3 Determine the critical value. The critical value is - (Round to three decimal places as needed.) Part 4 State…An educator wishes to determine whether there is a difference in the favorite subjects selected by males and females in college A random sample of males and females provides the data given in the tableAto. educator conclude that subject selection independent of the gender of the Ston all to HypthesisThe contingency table shows the result of a random sample of students by Ziyi Zhang at PCC and the number of hours they spend investing on Robinhood and Acorns by age and gender. At alpha =0.05, can you conclude that age is related to gender when it comes to time spent investing on Robinhood and Acorns. GENDER 16-20yrs 21-30yrs 31-40yrs 41-50yrs 51-60yrs 61yrs or older Male 45 170 90 72 45 26 Female 9 30 21 17 10 5 What is the Chi-square test statistics and the decision for this question. The Test statistics is . Leave your answer in 3 decimal places. DECISION: We the null hypothesis.
- The contingency table shows the result of a random sample of students by Lika Salmanyan at PCC and the number of hours they spend investing on Robinhood and Acorns by age and gender. At alpha =0.05, can you conclude that age is related to gender when it comes to time spent investing on Robinhood and Acorns. Gender 16-20yrs 21-30yrs 31-40yrs 41-50yrs 51-60yrs 61yrs or older Male 45 170 90 72 45 26 Female 9 30 21 17 10 5 What are the degrees of freedom? What is the critical value? Leave your answers in 3 decimal places The degrees of freedom is and the P- value is .1. During courtship males of the fiddler crab sometimes build sand hoods at the entrances of their burrows, to which they attract females for mating with claw waving and other displays. Researchers are interested to determine how hoods affect male attractiveness. Researchers conducted experiments that controlled for other differences in courtship behavior between builders and nonbuilders by removing hood builders' hoods and adding hood models to nonbuilders' burrows. a) What type of research design was used by the researchers? b) Is it a type of descriptive research or inferential research? Why?Remember that in Pisum sativum, yellow seed color is dominant over the green, and smooth seed is dominant over constricted. In a dihybrid cross experiment, the following data was gathered: 189 green, smooth 178 yellow, constricted 564 yellow, smooth 69 green, constricted Are these genes assort independently based on the observed data? Support your answer using the Chi-square test.
- 2. A psychologist at a private mental hospital was asked to determine whether there was a clear difference in the length of stay for patients with different categories of diagnosis. Looking at the last four patients in each of the three major categories, the results (in terms of weeks of stay) were as follows: Diagnosis Category Affective Disorders Cognitive Disorders Drug-Related Conditions 7 12 8 6 8 10 5 9 12 6 11 10 Using alpha = 0.05, is there a…14. The gene for the vasopressin receptor V1a is expressed at higher levels in the forebrain of monogamous vole species than in promiscuous vole species.11 Can expression of this gene infl uence monogamy? To test this, Lim et al. (2004) experimentally enhanced V1a expression in the forebrain of 11 males of the meadow vole, a solitary promiscuous species. The percentage of time each male spent huddling with the female provided to him (an index of monogamy) was recorded. The same measurements were taken in 20 control males left untreated. Control males: 98, 96, 94, 88, 86, 82, 77, 74, 70, 60, 59, 52, 50, 47, 40, 35, 29, 13, 6, 5 V1a-enhanced males: 100, 97, 96, 97, 93, 89, 88, 84, 77, 67, 61 a. Display these data in a graph. Explain your choice of graph. b. Which group has the higher mean percentage of time spent huddling with females? c. Which group has the higher standard deviation in percentage of time spent huddling with females?A panel of dentists is interested in testing two different toothpaste brands (A and B) to see if there is a relationship between the brand and whether or not the patient has a cavity at their next appointment. A representative sample of 60 patients is recruited to take part in this study. At their first appointment of the year, each subject is assigned to brush their teeth with one of the two brands for the next six months. At their follow-up appointment six months later, they were checked for cavities. ******In the sample, 6 of the 30 patients assigned to Brand A were found to have a cavity. The fraction 6/30 should be denoted by which of the following? μ x̄ p p̂ n s σ χ²