3) The coordinates of point P are (-4, 6) and the coordinates of point Q are (5, 1). M is the midpoint of [PQ]. a) Find the coordinates of M. L, is the line which passes through P and Q. b) Find the gradient of L1. A new line, L2, is perpendicular to L and passes through M. c) Write down the gradient of L2. d) Write down the equation of L2 in the form y = mx + b.
3) The coordinates of point P are (-4, 6) and the coordinates of point Q are (5, 1). M is the midpoint of [PQ]. a) Find the coordinates of M. L, is the line which passes through P and Q. b) Find the gradient of L1. A new line, L2, is perpendicular to L and passes through M. c) Write down the gradient of L2. d) Write down the equation of L2 in the form y = mx + b.

Algebra & Trigonometry with Analytic Geometry
13th Edition
ISBN:9781133382119
Author:Swokowski
Publisher:Swokowski
Chapter3: Functions And Graphs
Section3.3: Lines
Problem 31E

Related questions
Question
100%
![3) The coordinates of point P are (-4, 6) and the coordinates of point Q are (5, 1). M is the
midpoint of [PQ].
a) Find the coordinates of M.
L, is the line which passes through P and Q.
b) Find the gradient of L1.
A new line, L2, is perpendicular to L and passes through M.
c) Write down the gradient of L2.
d) Write down the equation of L2 in the form y = mx +b.](/v2/_next/image?url=https%3A%2F%2Fcontent.bartleby.com%2Fqna-images%2Fquestion%2F8beeba18-127d-4f79-b572-133114d91afd%2F9288364a-6824-4557-a7f8-250a6bfc603b%2Fv1mso7o_processed.jpeg&w=3840&q=75)
Transcribed Image Text:3) The coordinates of point P are (-4, 6) and the coordinates of point Q are (5, 1). M is the
midpoint of [PQ].
a) Find the coordinates of M.
L, is the line which passes through P and Q.
b) Find the gradient of L1.
A new line, L2, is perpendicular to L and passes through M.
c) Write down the gradient of L2.
d) Write down the equation of L2 in the form y = mx +b.
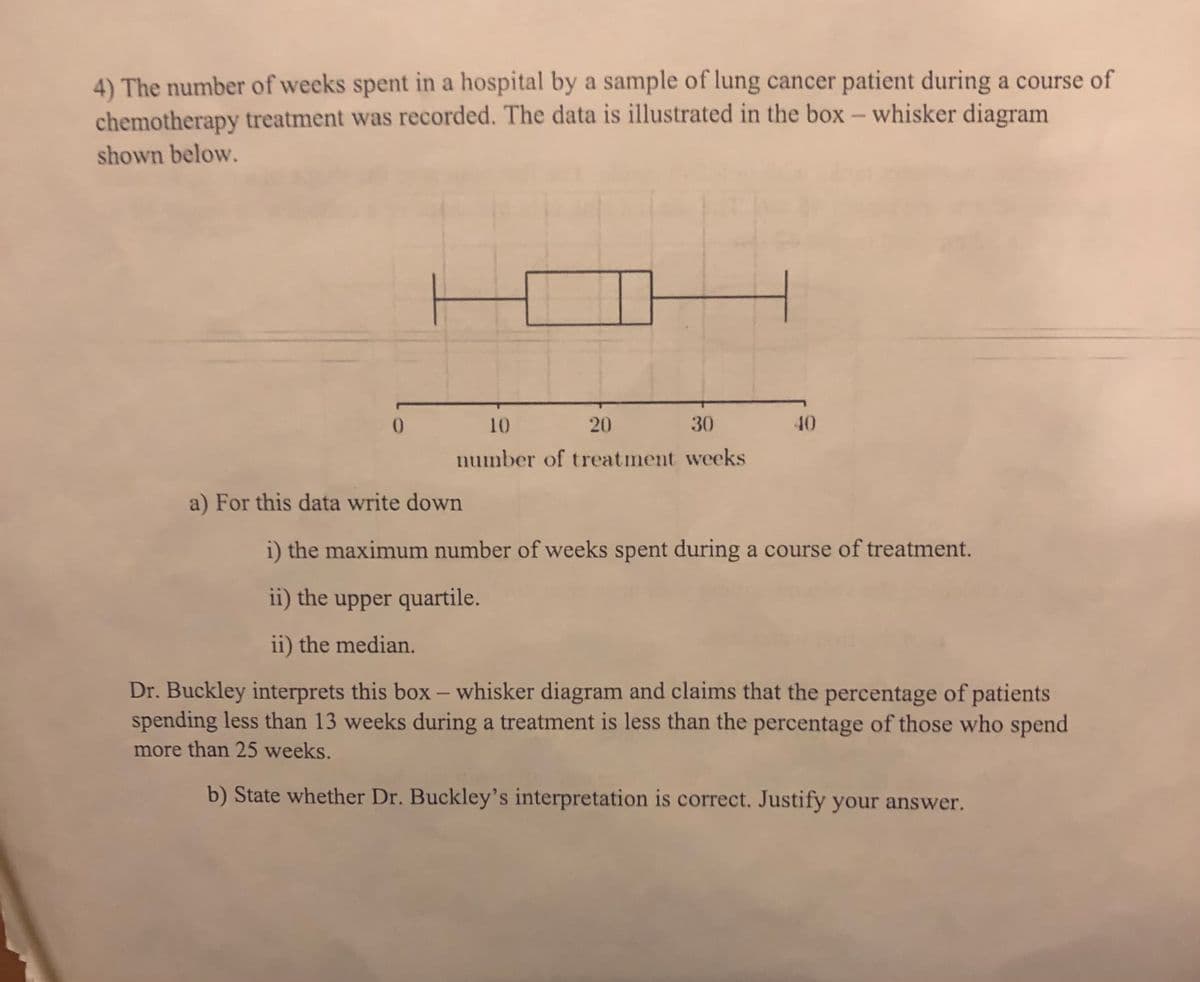
Transcribed Image Text:4) The number of weeks spent in a hospital by a sample of lung cancer patient during a course of
chemotherapy treatment was recorded. The data is illustrated in the box – whisker diagram
shown below.
10
20
30
40
number of treatment weeks
a) For this data write down
i) the maximum number of weeks spent during a course of treatment.
ii) the upper quartile.
ii) the median.
Dr. Buckley interprets this box - whisker diagram and claims that the percentage of patients
spending less than 13 weeks during a treatment is less than the percentage of those who spend
more than 25 weeks.
b) State whether Dr. Buckley's interpretation is correct. Justify your answer.
Expert Solution
This question has been solved!
Explore an expertly crafted, step-by-step solution for a thorough understanding of key concepts.

This is a popular solution!

Trending now
This is a popular solution!

Step by step
Solved in 4 steps with 3 images

Recommended textbooks for you
Algebra & Trigonometry with Analytic Geometry
Algebra
ISBN:
9781133382119
Author:
Swokowski
Publisher:
Cengage

Elementary Geometry For College Students, 7e
Geometry
ISBN:
9781337614085
Author:
Alexander, Daniel C.; Koeberlein, Geralyn M.
Publisher:
Cengage,
Algebra & Trigonometry with Analytic Geometry
Algebra
ISBN:
9781133382119
Author:
Swokowski
Publisher:
Cengage
Elementary Geometry For College Students, 7e
Geometry
ISBN:
9781337614085
Author:
Alexander, Daniel C.; Koeberlein, Geralyn M.
Publisher:
Cengage,