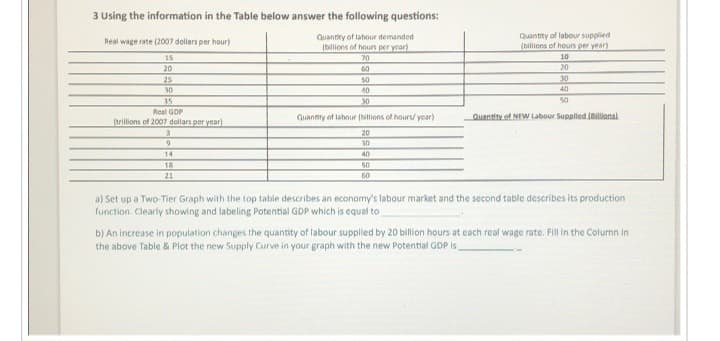
3 Using the information in the Table below answer the following questions: Quantity of labour demanded (billions of hours per year) 70 60 50 40 30 Real wage rate (2007 dollars per hour) 15 20 25 30 35 Real GDP (trillions of 2007 dollars per year) 3 9 14 18 21 Quantity of labour (billions of hours/ year) 20 30 40 50 60 Quantity of labour supplied (billions of hours per year) 10 20 30 40 50 Quantity of NEW Labour Supplied (Billional a) Set up a Two-Tier Graph with the top table describes an economy's labour market and the second table describes its production function. Clearly showing and labeling Potential GDP which is equal to b) An increase in population changes the quantity of labour supplied by 20 billion hours at each real wage rate. Fill in the Column in the above Table & Plot the new Supply Curve in your graph with the new Potential GDP is.
3 Using the information in the Table below answer the following questions: Quantity of labour demanded (billions of hours per year) 70 60 50 40 30 Real wage rate (2007 dollars per hour) 15 20 25 30 35 Real GDP (trillions of 2007 dollars per year) 3 9 14 18 21 Quantity of labour (billions of hours/ year) 20 30 40 50 60 Quantity of labour supplied (billions of hours per year) 10 20 30 40 50 Quantity of NEW Labour Supplied (Billional a) Set up a Two-Tier Graph with the top table describes an economy's labour market and the second table describes its production function. Clearly showing and labeling Potential GDP which is equal to b) An increase in population changes the quantity of labour supplied by 20 billion hours at each real wage rate. Fill in the Column in the above Table & Plot the new Supply Curve in your graph with the new Potential GDP is.

Principles of Microeconomics
7th Edition
ISBN:9781305156050
Author:N. Gregory Mankiw
Publisher:N. Gregory Mankiw
Chapter19: Earnings And Discrimination
Section: Chapter Questions
Problem 1PA

Related questions
Question
Note:The answer should be typed.
Transcribed Image Text:3 Using the information in the Table below answer the following questions:
Quantity of labour demanded
(billions of hours per year)
70
60
50
40
30
Real wage rate (2007 dollars per hour)
15
20
25
30
35
Real GDP
(trillions of 2007 dollars per year)
3
9
14
18
21
Quantity of labour (billions of hours/ year)
20
30
40
50
60
Quantity of labour supplied
(billions of hours per year)
10
20
30
40
50
Quantity of NEW Labour Supplied (Billional
a) Set up a Two-Tier Graph with the top table describes an economy's labour market and the second table describes its production
function. Clearly showing and labeling Potential GDP which is equal to
b) An increase in population changes the quantity of labour supplied by 20 billion hours at each real wage rate. Fill in the Column in
the above Table & Plot the new Supply Curve in your graph with the new Potential GDP is.
AI-Generated Solution

Unlock instant AI solutions
Tap the button
to generate a solution
Recommended textbooks for you
Principles of Microeconomics
Economics
ISBN:
9781305156050
Author:
N. Gregory Mankiw
Publisher:
Cengage Learning

Principles of Microeconomics
Economics
ISBN:
9781305156050
Author:
N. Gregory Mankiw
Publisher:
Cengage Learning