3. Assuming that the samples comes from normal distributions, find the margin of error E, given the following: a. n= 12, X 18, s = 3.0, 95% confidence b. n 16, X= 48, s = 3.2, 95% confidence %3D n = 18, X= 78.3, s= 2.5, 95% confidence C.
3. Assuming that the samples comes from normal distributions, find the margin of error E, given the following: a. n= 12, X 18, s = 3.0, 95% confidence b. n 16, X= 48, s = 3.2, 95% confidence %3D n = 18, X= 78.3, s= 2.5, 95% confidence C.

Glencoe Algebra 1, Student Edition, 9780079039897, 0079039898, 2018
18th Edition
ISBN:9780079039897
Author:Carter
Publisher:Carter
Chapter10: Statistics
Section10.4: Distributions Of Data
Problem 19PFA

Related questions
Question
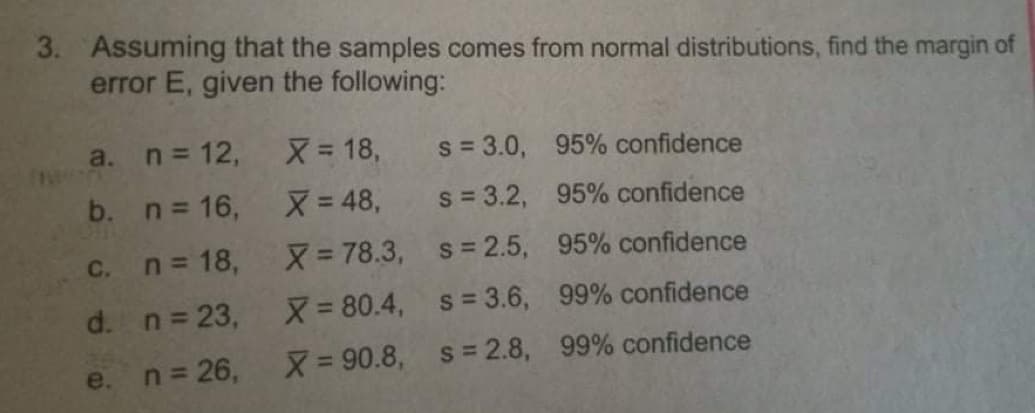
Transcribed Image Text:3. Assuming that the samples comes from normal distributions, find the margin of
error E, given the following:
a. n 12,
X= 18,
s = 3.0, 95% confidence
b. n 16,
X= 48,
s = 3.2, 95% confidence
C.
n = 18,
X= 78.3, s= 2.5, 95% confidence
d. n= 23,
X 80.4, s= 3.6, 99% confidence
n = 26,
X= 90.8, s= 2.8, 99% confidence
e.
Expert Solution
This question has been solved!
Explore an expertly crafted, step-by-step solution for a thorough understanding of key concepts.

Step by step
Solved in 3 steps with 2 images

Recommended textbooks for you
Glencoe Algebra 1, Student Edition, 9780079039897…
Algebra
ISBN:
9780079039897
Author:
Carter
Publisher:
McGraw Hill
Glencoe Algebra 1, Student Edition, 9780079039897…
Algebra
ISBN:
9780079039897
Author:
Carter
Publisher:
McGraw Hill