3. Calculate the disturbance and lead transfer function. What is the behavior? Draw the Bode diagram of the open circle. Under what conditions is the circle stable. Enter Krfor aphase reserve of 30 degrees. Wis) STeliglied oute X(s) Kr 2x+1 Ss+1 Messglied
3. Calculate the disturbance and lead transfer function. What is the behavior? Draw the Bode diagram of the open circle. Under what conditions is the circle stable. Enter Krfor aphase reserve of 30 degrees. Wis) STeliglied oute X(s) Kr 2x+1 Ss+1 Messglied

Delmar's Standard Textbook Of Electricity
7th Edition
ISBN:9781337900348
Author:Stephen L. Herman
Publisher:Stephen L. Herman
Chapter24: Resistive-inductive-capacitive Parallel Circuits
Section: Chapter Questions
Problem 4RQ: A tank circuit contains a capacitor and an inductor that produce 30 of reactance at the resonant...

Related questions
Question
9
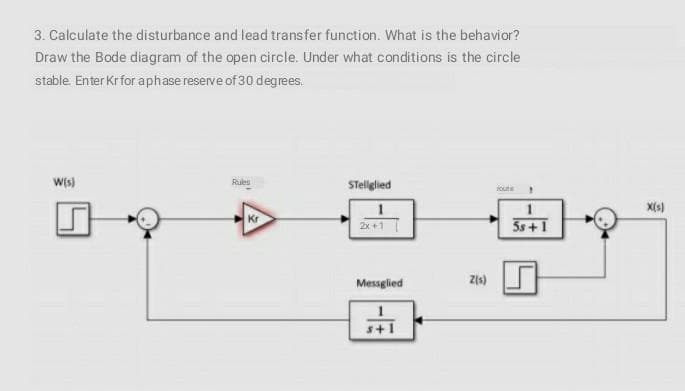
Transcribed Image Text:3. Calculate the disturbance and lead transfer function. What is the behavior?
Draw the Bode diagram of the open circle. Under what conditions is the circle
stable. Enter Krfor aphase reserve of 30 degrees.
W{s)
Rues
STellglied
foute
X(s)
Kr
2x +1
5s+1
Messglied
Zis)
s+1
Expert Solution
This question has been solved!
Explore an expertly crafted, step-by-step solution for a thorough understanding of key concepts.

Step by step
Solved in 7 steps with 4 images

Recommended textbooks for you
Delmar's Standard Textbook Of Electricity
Electrical Engineering
ISBN:
9781337900348
Author:
Stephen L. Herman
Publisher:
Cengage Learning
Delmar's Standard Textbook Of Electricity
Electrical Engineering
ISBN:
9781337900348
Author:
Stephen L. Herman
Publisher:
Cengage Learning