3. Complete the below table to calculate the balance sheet data in trend percents with 2019 as base year. (Round your percentage answers to 2 decimal places.) KORBIN COMPANY Balance Sheet Data in Trend Percents December 31, 2021, 2020 and 2019 2021 2020 2019 Assets Current assets 100.00 % Long-term investments Plant assets, net 100.00 100.00 100.00 % Total assets Liabilities and Equity Current labilities 100.00 % Common stock 100.00 Other paid-in capital 100.00
3. Complete the below table to calculate the balance sheet data in trend percents with 2019 as base year. (Round your percentage answers to 2 decimal places.) KORBIN COMPANY Balance Sheet Data in Trend Percents December 31, 2021, 2020 and 2019 2021 2020 2019 Assets Current assets 100.00 % Long-term investments Plant assets, net 100.00 100.00 100.00 % Total assets Liabilities and Equity Current labilities 100.00 % Common stock 100.00 Other paid-in capital 100.00

Intermediate Accounting: Reporting And Analysis
3rd Edition
ISBN:9781337788281
Author:James M. Wahlen, Jefferson P. Jones, Donald Pagach
Publisher:James M. Wahlen, Jefferson P. Jones, Donald Pagach
Chapter22: Accounting For Changes And Errors.
Section: Chapter Questions
Problem 4RE: Refer to RE22-2. Assume Heller Company had sales revenue of 510,000 in 2019 and 650,000 in 2020....

Related questions

Question
Please help me
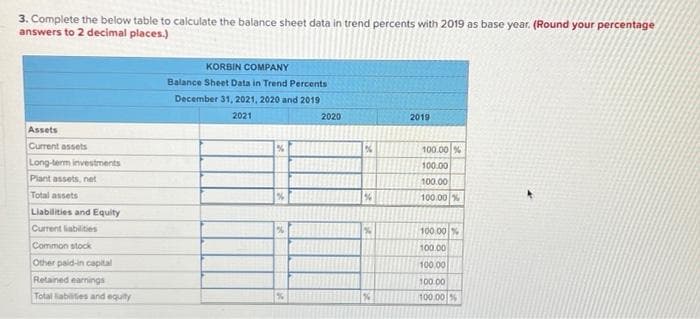
Transcribed Image Text:3. Complete the below table to calculate the balance sheet data in trend percents with 2019 as base year. (Round your percentage
answers to 2 decimal places.)
KORBIN COMPANY
Balance Sheet Data in Trend Percents
December 31, 2021, 2020 and 2019
2021
2020
2019
Assets
Current assets
100.00 %
Long-term investments
100.00
Piant assets, net
100.00
Total assets
100.00 %
Liabilities and Equity
Current liabilities
100 00
Common stock
100.00
Other paid-in capital
100.00
Retained earnings
100.00
Total liabilities and equity
100.00 %
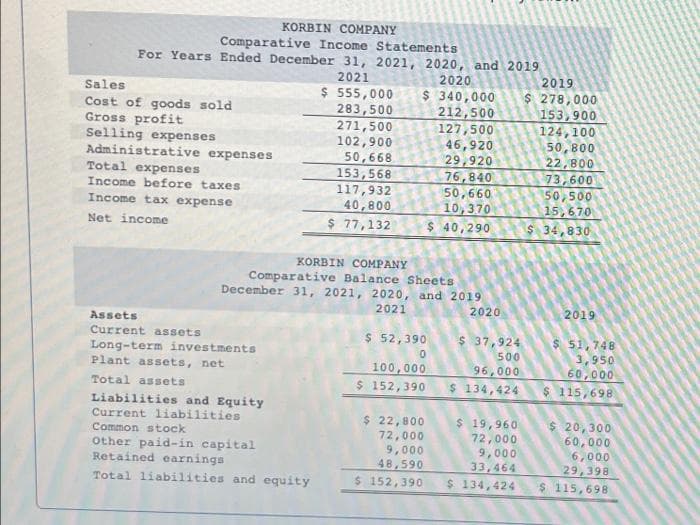
Transcribed Image Text:KORBIN COMPANY
Comparative Income Statements
For Years Ended December 31, 2021, 2020, and 2019
2021
2020
2019
$ 555,000
283,500
271,500
102,900
50,668
153,568
117,932
40,800
$ 77,132
Sales
$ 340,000
212,500
127,500
Cost of goods sold
Gross profit
Selling expenses
Administrative expenses
Total expenses
Income before taxes
Income tax expense
46,920
29,920
76,840
50,660
10,370
$ 40,290
$ 278,000
153,900
124,100
50,800
22,800
73,600
50,500
15,670
$ 34,830
Net income
KORBIN COMPANY
Comparative Balance Sheets
December 31, 2021, 2020, and 2019
2021
2020
2019
Assets
Current assets
$ 52,390
$ 37,924
$ 51,748
3,950
60,000
$ 115,698
Long-term investments
Plant assets, net
100,000
$ 152,390
500
96,000
$ 134,424
Total assets
Liabilities and Equity
Current liabilities
Common stock
Other paid-in capital
Retained earnings
$ 22,800
72,000
9,000
48,590
$ 19,960
72,000
9,000
33,464
$ 20,300
60,000
6,000
29,398
$ 115,698
Total liabilities and equity
$ 152,390
$ 134,424
Expert Solution
This question has been solved!
Explore an expertly crafted, step-by-step solution for a thorough understanding of key concepts.

This is a popular solution!

Trending now
This is a popular solution!

Step by step
Solved in 2 steps with 1 images

Knowledge Booster


Learn more about
Need a deep-dive on the concept behind this application? Look no further. Learn more about this topic, accounting and related others by exploring similar questions and additional content below.Recommended textbooks for you
Intermediate Accounting: Reporting And Analysis
Accounting
ISBN:
9781337788281
Author:
James M. Wahlen, Jefferson P. Jones, Donald Pagach
Publisher:
Cengage Learning

Cornerstones of Financial Accounting
Accounting
ISBN:
9781337690881
Author:
Jay Rich, Jeff Jones
Publisher:
Cengage Learning

Intermediate Accounting: Reporting And Analysis
Accounting
ISBN:
9781337788281
Author:
James M. Wahlen, Jefferson P. Jones, Donald Pagach
Publisher:
Cengage Learning
Cornerstones of Financial Accounting
Accounting
ISBN:
9781337690881
Author:
Jay Rich, Jeff Jones
Publisher:
Cengage Learning