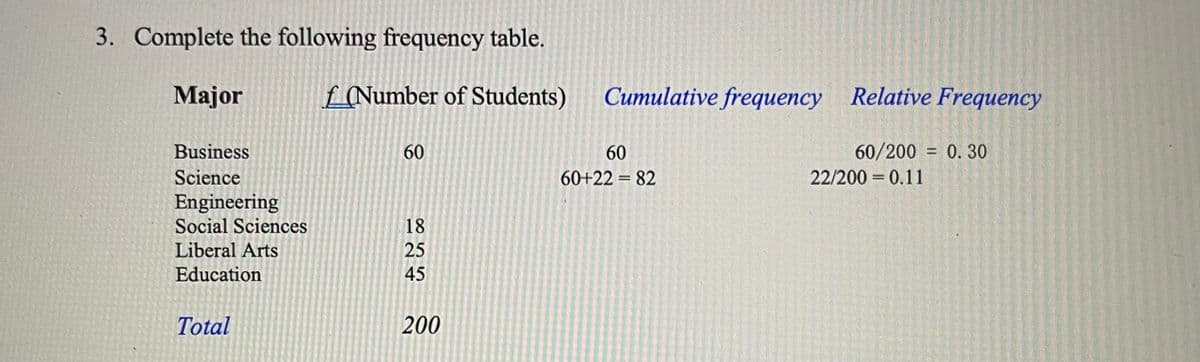
3. Complete the following frequency table. Major £Number of Students) Cumulative frequency Relative Frequency Business 60 60 60/200 = 0. 30 Science 60+22 = 82 22/200 = 0.11 Engineering Social Sciences Liberal Arts Education 18 25 45 Total 200


Q: 11. The following chart shows the winning Olympic Men's High Jump distances. Height (inches) Year…
A: Year Height 1900 76 1904 79 1908 85 1912 89 1920 94 1924 98 1928 96 1932 107 1936…
Q: Example 2 Represented the following data using percentage bar diagram. States: Karnataka Tamilnadu…
A:
Q: 9 10 11 12 13 14 15 16 17 18 19 20 data 8 Based on the boxplot above, identify the 5 number summary
A: The 5-number summary is defined as, the minimum value, the lower quartile, the median, the upper…
Q: Example(2):- The following data represents temperature of Baghdad city: 30 35 38 40 42 34 39 41 34…
A: Given : The data of temperature of Baghdad city : 30 35 38 40 42 34 39 41 34…
Q: If ten supermarkets are selling a chocolate bar for 1.15 JD, five are selling it for 1.25 JD, and…
A: From the given information, the chocolate prices of all 18 supermarkets in ascending order is as…
Q: Prepare a frequency Histogram and Polygon from the data in the frequency distribution below…
A: Frequency histogram:
Q: The following frequency table contains the total number of deaths worldwide a from 2000 to 2012.…
A: Given: Data of total occurred deaths; To determine: Percentage of deaths occurred after 2009:…
Q: Question 2: Find the median for the following data Marks |45 – 49| 50 – 54 |55 – 59|60 – 64 |65 – 69…
A: The median is the value separating the higher half from the lower half of a data sample, a…
Q: Given the following data, 1 1 2 2 3 3 4 4 5 5 5 6 6 6 7 8 9 9 9 9 1) histogram of data. Give the…
A:
Q: The scatter diagram matches the data: Age Medical Expenses 79 246 5 310 15 150 210 360 81 490 46 100…
A: Given data is: We have to check either the scatter data…
Q: If frequency of an item a is given as 4, and total number of items in the collected data is 44; then…
A:
Q: + 10 11 12 13 16 15 14 data 17 18 19 Based on the boxplot above, identify the 5 number summary
A: Given data
Q: Table 1 Frequency City (Millions of people) Relative Frequency Los Angeles 3.83 0.2048 Chicago 2.84…
A: The total population of US is 300 millions and frequency of Los Angeles is 3.83 millions.
Q: Nineteen people were asked how many miles, to the nearest mile, they commute to work each day. The…
A: We have given that the data of 19 people were asked how many miles they commute to work each day.…
Q: Table 3a shows the salaries of 150 faculty members (in thousands of Rupees) of a reputed University.…
A: Given that N=150
Q: 2.4 Complete the following table: Grade on Statistics Relative Exam Frequency Frequency A: 90-100 B:…
A: The relative frequency of any class is the ratio between the frequency of that class and the total…
Q: Please Provide: Frequency Distribution Table Containing:
A: A frequency distribution table summarizes the frequency of the data in a tabular form.
Q: 12. The library sold the following number of books each day during the first two weeks of this…
A: To find the interquartile range of the given data
Q: 3.) Construct a frequency and a relative frequency histograms using 5 classes: 12 45 67 88 98 76 56…
A: Thank you for the question. Since multiple questions are posted, according to our policy, we are…
Q: Title 1 7 13 19 25 31 37 data Based on the histogram above, what is the frequency of the class…
A: Solution-: We want to find the frequency of the class containing the value 8 for given histogram
Q: Example 1 university. Pepresents the pass percentage of students from Bangalore 1995 1996 Years:…
A:
Q: Calculate the coefficient of concurrent deviations from the data given below: Year 1993 1994 1995…
A: Price sign a=sign( deviation from previous value) Demand sign b=sign(deviation from previous value)…
Q: Interpret the following Tables/Statements below comprehensively Table R : Educational Background of…
A: Here , the frequency table is given. So by using percentage column we can interpret the given table…
Q: To analyze how Arizona workers ages 16 or older travel to work (carpool, private vehicle, public…
A: Find your answer below
Q: is summarised in this frequency table. Age 15-29 30-44 45-59 60 and above Driver 348 237 119 147…
A: “Since you have posted a question with multiple sub-parts, we will solve first three subparts for…
Q: A librarian recorded the ages of a sample of adult patrons and recorded the data in the following…
A: Given data, 21,23,27,28,29,30,39,44,45,47,47,56,61,63 Fill the frequency table
Q: SHORT QUIZ I. Complete the following table using the data below. Area 1 50 3.5 1.20 48 36 4.8 83 75…
A:
Q: Frequency Distribution - Both 50 40 30 20 10 140 – 154 155 – 169 170 – 184 185 – 199 200 – 214…
A:
Q: South Asia Africa Totals America Malaria 31 14 45 90 Malaria B Malaria 53 60 53 45 100 Totals 86 64…
A: Given data: The provided contingency table is, Let the level of significance = 0.05. To test the…
Q: Consider the given data 18 18 18 19 19 20 20 20 20 21 24 24 26 28 32 34 36 41 44 48 Use 5 classes,…
A: Given data set is 18 18 18 19 19 20 20 20 20 21 24 24 26 28 32 34 36 41 44 48 N=Total no. of…
Q: The results of a survey of 150 students about whether they own an electronic tablet or a laptop are…
A:
Q: 2. A group of adults where asked how many cars they had in their household a. Complete the frequency…
A: Consider the given equation: Here, the given data of cars they had in their household,
Q: Part B Statistics Given the following data 38 8 42 6 12 42 9 44 12 14 45 53 16 48 18 19 54 23 21 59…
A: Given data, 38,8,42,6,12,42,9,44,12,14,45,53,16,48,18,19,54,23,21,59,24,26,32,35,37 Sort the data…
Q: (a) If 75% of the items were sold in birr 45 or less and most items were sold in birr 34, find the…
A:
Q: Complete the frequency distribution table: Frequency descending cumulative frequency Classes Class…
A: An incomplete frequency table is given.
Q: Refer to the table below that shows the frequency distribution of the heights of 45 SHS students.…
A:
Q: 2 9 11 11 13 14 14 15 15 16 16 17 17 18 18 18 18 19 19 20 give the five-number summary. find…
A: We have been given the data as, 2 9 11 11 13 14 14 15 15 16 16 17 17 18 18 18 18 19 19 20 We have,…
Q: Table 1 Frequency City (Millions of people) Relative Frequency Los Angeles 3.83 0.2048 Chicago 2.84…
A: Zipf's law The frequency of the kth most frequent word ∝ 1/k
Q: 1. There is a group of data as follows: 83 75 66 26 37 87 24 77 90 84 34 22 31 68 92 46 81 41…
A: Given the data as 83, 75, 66, 26, 37, 87, 24, 77, 90, 84, 34, 22, 31, 68, 92, 46, 81, 41
Q: A survey is given to 1,432 people about whether they take daily supplemental vitamins and whether…
A: %frequency =(frequency /total number of value)x100 take daily vitamins no daily vitamins eat…
Q: Short Answer Questions 6-9 will use the data below representing a frequency distribution for majors…
A:
Q: A frequency table about degrees of 40 CEOs was given: Degree Frequency Bachelors 8 Laws 4 Masters…
A: given that frequency table about degrees of 40 CEOs was given: Degree Frequency Bachelors 8…
Q: Karla owns a knitting business and recently took inventory of her stock of knit hats by color. The…
A: Given that Karla owns a knitting and recently took inventory of her stock of knit hats by color. The…
Q: The histogram for data is attached: Does it form a bell shaped curve? explain what this means and…
A: A distribution is known to be positively or right skewed if most of the data is on the right side of…
Q: refer to the following: For countries listed in the Human Development Report, the correlation…
A: Given: The correlation coefficient between: Percent of people using the internet and per capita GDP…
Q: : 8:38. Calculate the coefficient of concurrent deviations for the following data : ww Supply 65 40…
A:
Q: Example 3 Draw bar diagram for the following data. Years 1996 1997 1998 1999 2000 2001 Scale (*000)…
A: We have the following data to draw a bar diagram.
Q: simplify the data.
A: A frequency distribution displays various outcomes in a sample. Frequency indicates the number of…
Q: (3.36 Draw (i) a Histogram and (ii) an Ogive from the following data: Daily wages (Rs.) 4-6 6-8 8-10…
A: Given frequency distribution: Daily wages No. of employees 4-6 13 6-8 111 8-10 182 10-12…

Step by step
Solved in 2 steps with 1 images

- Calculate the point prevalence for Alzheimer’s disease among individuals 65 years of age or older in a county that has 200,000 individuals who are 65 years of age or older, if 22,223 individuals who are 65 years of age or older have the disease.Enumerate the activities involved in the study of statistics according to its correct arrangement.Create a Frequency Distribution Table and compute for the Mean, Median, Mode, Variance, and Standard Deviation of the scores of 40 ENGDATA students during their first quiz.Please show solution and step by step process
- Compute 70th percentile and compute the interquartile range 50,47,58,53,66,81,73,65,51,71,58Among fatal plane crashes that occurred during the past 50 years, 634 were due to pilot error, 95 were due to other human error, 109 were due to weather, 438 were due to mechanical problems, and 204 were due to sabotage. Construct the relative frequency distribution. What is the most serious threat to aviation safety, and can anything be done about it?Calculate the mean number of hours per week spent by 42 students studying online during the pandemic
- A bank auditor used a random sample of 100 accounts and found out that the average demand deposit balance was shs 549.82 if the auditor needs a point estimate for the population mean foe all accounts at this bank what would she use.The Following are Data for Systolic Blood Pressures, in mm of Mercury, of 12 Chimpanzees. 121, 125, 128, 134, 136, 138, 139, 141,144, 145, 149, 151 Based on this sample, do chimps have higher systolic blood pressure than humans, their closest relatives? Make sure you state the statistical hypotheses and conclusions, as well as the biological conclusions.Suppose that the frequency table below contains data on male life expectancy at birth in 99 randomly selected countries. Use the table to determine the median life expectancy for males in these 99 countries
- If the mean of examination scores for two classes of the same level: A and B, in a certain school are 73 and 59 respectively. Find the combined mean score for both classes if there are 25 students in class A and 18 in class B.A psychology office at a certain college conducted a study on student risk,from that same institution, suffer depression. To this end, he accompanied 25 students,having reached the following conclusion: 2 have a high risk, 10 a low risk, 5 a riskmedium, 1 very high risk and 7 very low risk. Build the frequency table foravailable data, obtain adequate graphic representations and determine statistical measuresappropriate. Analyze the results.A random sample of 60 students in the business statistics course answered a survey on the average number of hours they spent on statistics each week. Unfortunately, the original data were lost, and all that remains is the frequency table below. From these data, calculate the estimated sample mean. Show the complete calculation steps.