

Q: Consider the function in the graph below. 10+ 5- 4- 3- (5,2) 10 -9 -8 -7 -6 -5 -4 -3 -2 -1 I 2 3 4 5…
A:
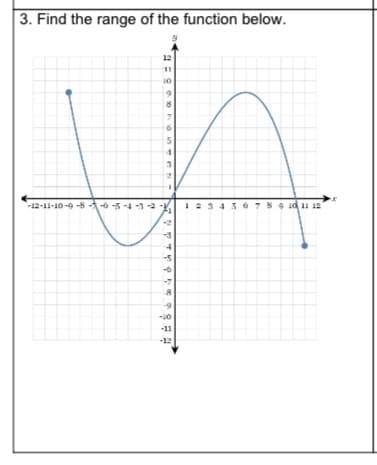
Q: What is the range of the function shown in the graph below? 12 11 10 7 4. 3 2 12-11-10-9 -8 -7 -6 -5…
A:
Q: 5) When calculating L{f(t)} huhere f(t) is the function whose graph is shown in the attached figure,…
A:
Q: 10- -10 10 8- The graph of f(z) is shown in the figure. Where is f'(1) < 0? Select the correct…
A:
Q: If k() -9-7 and g(t)- t--1, 3.1 Sketch the function h () - In(g()).
A:
Q: -10 -8 -2 10 Based on the graph of f(x) in the figure, determine where f'(x) > 0. Select the correct…
A: Given,f'(x)>0 We know that,If f'(x)<0,Function is a decreasing function, f'(x)>0,Function…
Q: 7. Which of the following scenarios does NOT always illustrate a function? A. The relation of the…
A:
Q: II. Given the function g defined by g(x) = -* if x*-2 4. if x=-2 Find the value of the indicated…
A: at x=-2, function is defined as:g(x)=-4; if x=-2ANSWER 14:g(-2)=4
Q: The graph of the function is sketched as follows: 12 8. -12 -8 12 .4 -8 -12 Determine the interval…
A: Explanation of the answer is as follows
Q: -10 -9 -8- -5 -3 -1 3. 4. 6. -1 9 10 -2 -3 -4 -5 -7 -8 From the figure given above, it can be seen…
A: These are application of derivative . When f'(x)<0, function is decreasing . When f'(x)>0,…
Q: 1. (6 pts) Use the graph of the function f(x) below to answer the following: (a) Find the domain and…
A: (a) each square in the grid has side equal to 1 unit. first we will see about the range. range is…
Q: 1 Use the given graphs of f and g to estimate the value of f(g(x)) for x = -5, -4, -3, ..., 5. Use…
A: See the attachment
Q: What is the range of the function shown in the graph below? 12 11 10 8. 7 6. 4 -12-11-10-9 -8 -7 -6…
A: Explanation of the answer is as follows
Q: 1. On the lines provided, state the intervals on which the function is increasing, decreasing, and…
A:
Q: The graph of f(x) is shown. Which graph would best represent the graph of f'(x)? 4 54 3-2 1 2 3 45 4…
A: Consider the given graph. let the graph passing through the points x1,y1=1,2 and x2,y2=2,4. Obtain…
Q: 10 5 18 x -10 -5 -5 -10 Given the graph of f(x) above, find the following and write your answer in…
A: Domain and Range.
Q: 1.0 1,0 F6 (-1-2) (1,-3) Given the graph of y = f(x), as shown above: 1. What is the domain of f(x)?…
A: We have to find the domain and range of function y=fx since we know that domain is the value of x…
Q: 9. Which of the Following are correct representations of the range of the function shown in the…
A: The range is the set of all real numbers less than or equal to 5.
Q: 4. 41) Determine the intervals over which the function is increasing, decreasing, or constant. f (x)…
A:
Q: a) Are there some functions that don’t have extreme values in a given interval? YES/NO. b) If you…
A:
Q: etermine the range of the following graph: 12 11 10 9. 7 -12-11-10-9 -8 -7 -6 -5 -4 -3- 9 10 11 12
A: Given the graph for a function. We need to find the range of the following graph .
Q: 9. Use the given graph of the function f to answer parts (a)-(n). (2, 4) (4, 3) (0, 3). (10. 0) (11,…
A: From the given graph we have to find the following: a)f(0) and f(-6) b) f(6) and f(11) c) f(3) is…
Q: 1(x) 16 14 12 10 -10 -8 7 6 5 4. and (x|x < The graph is below the x-axis on the intervals (x|1<x <…
A: we can see the graph of a function which is negative x is from 1 to 2 and x is less than -1 , it…
Q: -54 -3 -2 -1 4. -2- -4 The function graphed above is: Increasing on the interval(s) Decreasing on…
A:
Q: 31. The graph of which function is always below the graph of the function Y = (x + 1)² + 1? O y = 1–…
A: Lets look at the graph of y = (x+1)2+1 we can see it is upward parabola with centre at (-1,-1) To…
Q: х2-х-6 9. Given the function f (x) = Determine the following: х2+2х-8' i. Graph
A: sketch the graph of given function
Q: a. Find the domain and the range then draw the function y =x+3-1. b. Prove that coth x-1=csch²x
A: Part a,Given, The function is y=x+3-1 .
Q: 1.5 When a function f is even, then for every point (x, y) on the graph of fhere exists another…
A: If the given function is even or odd, you have to put the value of x is -x after the application if…
Q: 12. Use the given graph of the function f to answer parts (a)-(n). 4 (5, 3) (-4, 2) (-2, 1) 2 (4, 0)…
A: topic - functions Note :As per bartleby guidelines, we are supposed to answer only first three…
Q: Given: 10 f(2) - 1 3z +9 > -5 Which point below is on the graph of f(x)? a) 0(-5, –6) b) 0(-4, -3) )…
A:
Q: 4) The function f has the property that f, f', f" are negative for all values of x. Which of the…
A:
Q: 6 Find the domain of each of these functions if it is known that the range is (-3, -2,-1, 0, 1, 2).…
A:
Q: 5+ 1. Use the graph to answer the following questions: 4+ a. What is the domain? 3- b. What is the…
A: a. Domain of a function is all possible x values From the graph, the domain of the given function is…
Q: Can someone help me solve this problem?
A: Given a graph of a function,To determine the interval where the function is increasing, decreasing…
Q: 10. Which of the following is the possible sketch of the graph of a function with an odd degree and…
A: A polynomial's degree is the highest or the greatest power of a variable in a polynomial equation.…
Q: (3,1) -6 (-1,-4) -6 Given the graph of y = f(x), as shown above: 1. What is the domain of f(x)? 2.…
A: The given graph of the function y=f(x) is:
Q: Given that f'(a) - which of the following graphs could be the graph of f(z)? (a- 1)" -10 -5 5 a) O…
A:
Q: -10 -2 6 -2 4 -6 10- Based on the graph of f(x) in the figure, determine where f' (x) > 0. Select…
A: We have given a graph of f(x). we have to determine where f'(x)>0.
Q: ++ -6.2-4.71 -3.14 –-1.57, 1.57 3.14 4.71 6.2 x -2
A: g(x)=x/2 For detail analysis...go through the solution , I have explained step by step with graph
Q: 8. The graph of f(x) = x2 was transformed to create h(x) = f(x + 8). 9. Carmela translates f(x) = x2…
A: These problems can be answered by the concepts of translation of y=f(x) along the x-axis and the…
Q: 9. The graph of a function p(x) is shown. Draw the graph of -p(x- 1)-3. -6 -5 4 -3 2 7 8 9 -1 -1 -2…
A:
Q: 8. The graph of f(x) is shown below. Estimate and list the value of x where f(x) has a horizontal…
A:
Q: Can someone help me solve this problem?
A: A function f is even if the graph of f is symmetric with respect to the y-axis.This graph does not…
Q: 2 of The function is graphed below. sig(t) 1.0 - 0.8- 0.6- 0. 0.2- -8 -6 -4 -2 Find the signs of the…
A: At x = 2, the graph is above the x-axis, it means it has positive value, so f(2) > 0 or + At x =…
Q: Suppose, for a given function, we know that the point (2,5) is on the function's graph. If f(x) is…
A:
Q: 3. Let D, and be the domain and range of f. Let D, and R. be the domain and range of g. Use the…
A:


Trending now
This is a popular solution!

Step by step
Solved in 2 steps with 2 images


- b) Make a frequency polygon of the test scores.Apparent Limits frequency93-95 190-92 287-89 684-86 881-83 978-80 775-77 672-74 369-71 466-68 263-65 060-62 2A study is published with information about ages of people in a particular region. A sample of five residents from the region have the following ages, in years. Complete parts (a) through (d) below. 15 12 25 83 2 a. Determine the range of these ages.180.5 181.7 180.9 181.6 182.6 181.6181.3 182.1 182.1 180.3 181.7 180.5Compute the following:a. Range
- The dropdowns that say "select"on part b and c are saying "is it increasing, decreasing or constant"Here is a data set: 152 157 165 206 208 212 219 235 236 246 248 260 262 267 273 273 274 275 283 286 304 310 315 334 335 343 345 395 Construct a frequency distribution table for this data set. Number of classes: 10 Use a "nice" class width, such as a multiple of 5 or 10. Label classes using interval notation. For example, if the class is 70-79, label it as [70,79]. The lower class limit should be a multiple of the class width. For example, if the class width is 10, the lower class limit should be a number like 30 or 40 (depending on the data). Data range FrequencyIf the lower limit of a class is 17 and the class midpoint is 20.5, what is the upper limit? 23 25 26 24
- A data set with whole numbers has a low value of 20 and a high value of 117.Find the class width for a frequency table with seven classes.Find the class limits for a frequency table with seven classes. Lower class limit − Upper class limit First class − Second class − Third class − Fourth class − Fifth class − Sixth class − Seventh class −A study is published with information about ages of people in a particular region. A sample of five residents from the region have the following ages, in years. Complete parts (a) through (d) below. 85 28 13 84 12 a. Determine the range of these ages. The range is enter your response hereA quantitative data set has been grouped by using limit grouping with equal-width classes. The lower and upper limits of the first class are 3 and 8, respectively, and the class width is 6. a. What is the class mark of the second class?b. What are the lower and upper limits of the third class?c. Which class would contain an observation of 23?
- Below is a frequency table. Find the mean, mode, and median. Limits Frequency (f) 110-115 19 116-121 24 122-127 18 128-133 21 134-139 9 140-145 21 146-151 1725.9 32.4 33.1 19.1 17.5 24.9 21.0 45.1 30.8 34.3 27.1 29.1 25.6 31.3 23.2 24.1 23.9 25.9 18.6 Finf the upper and low limits for 75% ChebyshevA pediatrician wants to determine the relation that may exist between a child's height and head circumference. She randomly selects 8 children from her practice, measures their height and head circumference and obtains the data shown below. Height Head Circumference 27 17.5 25 17 26.5 17.2 25.5 17 27.75 17.4 26.25 17.4 26 17.1 27.25 17.4 data table 3 0.997 4 0.950 5 0.878 6 0.811 7 0.754 8 0.707 9 0.666 10 0.632 11 0.602 12 0.576 13 0.553 14 0.532 15 0.514 16 0.497 17 0.482 18 0.468 19 0.456 20 0.444 21 0.433 22 0.423 23 0.413 24 0.404 25 0.396 26 0.388 27 0.381 28 0.374…