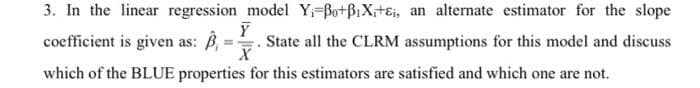
3. In the linear regression model Y₁ Bo+B₁X₁+Ei, an alternate estimator Y Â₁=X. State all the CLRM assumptions for this mo coefficient is given as: B


Q: ean and Mode are Given as 30 and 15, respectively. Value of Median is -(a) 25 (b) 26 (c) 24.5 (d)…
A: Given Mean = 30 Mode = 15
Q: Identify the lower class limits, upper class limits, class width, class midpoints, and class…
A:
Q: Some researchers developing a new intelligence test are trying to decide the maximum time to allow…
A: From the given histogram we can see that there are 7 data points between 500 sec and 700 sec, 9 data…
Q: Suppose you wish to determine the degree to which annual earnings of professional golfers (Earnings)…
A: In the above question, the annual earnings of professional golfers (Earnings) is dependent variable…
Q: We wish to estimate what percent of adult residents in Ventura County like chocolate. Out of 500…
A: Given that Sample size n =500 Favorable cases x =302
Q: A certain counselor wants to compare mean IQ scores for two different social groups. A random sample…
A: Given that Sample sizes n1=13 , n2=11 Sample means X̄1=103 , X̄2=116 s1 =15…
Q: 7) Suggest an appropriate specification of ARMA model for the data, for which the following results…
A: The objective is to identify the suitable ARMA model of order (p,q) using the given ACF and PACF…
Q: B. The average exam score for 10 students in a statistics class was 85. One student dropped the…
A: Given When n=10, average exam score for 10 students in a statistics x̄=85 When one student dropped…
Q: Stem Leaf 1234578 A 65 01159 13678 C 74 0133367 235579 What is the range for the above stem and leaf…
A: From given data Max. Value = 84 Min. Value = 10
Q: Find a function g so that, if U is uniformly distributed over the interval [0, 1], g(U) is…
A:
Q: Show that 2"=nCk and 0 = [(-1)^nck k=0 HINT: Consider(1-1)" and (1+1)" k=0
A:
Q: A process of drawing a sample is called Sampling Census Both none
A: Given that Simple random sampling: A procedure for selecting a sample of size n out of a finite…
Q: anufacturer claims that their bulb had a better performance with an average life span of 40 months…
A: Given: China Population mean μ1 =40 Population standard deviation σ1=3.5 x1 = 42 X1 ~ N (40, 3.52)…
Q: Discuss the statement and tell what possible misuse or misinterpretation may exist. Suppose seventy…
A: Given statement 70 % of accidents occur within 8 miles of home. Therefore, it is safer not to drive…
Q: Use the sample information = 38, σ= 4, n=11 to calculate the following confidence intervals for μ…
A: Given that Sample size n =11 Sample mean =38 Population standard deviation =4
Q: The hospital record shows that the mean weight of newly born baby is 7 lbs with the standard…
A:
Q: RX 350 four-wheel drive 6 cylinder 3.5-L automatic 5-speed using premium fuel is a normally…
A: Given that Mean = 26.75 Standard deviation = 3.50 Sample size = 36
Q: a. For this study, we should use Select an answer b. The null and alternative hypotheses would be:…
A: Note: According to bartleby experts question answers guidelines an expert can solve only first three…
Q: A random variable X has the following probability distribution. 4 6 0.3 0.2 If a sample of size 2 is…
A:
Q: The number X of insect larvæfound on a cm² on a petri plate is assumed to follow a Poisson…
A:
Q: Suppose x has a distribution with a mean of 80 and a standard deviation of 4. Random samp (a)…
A: Given that Mean = 80 Standard deviation = 4 Sample size = 64 Note : According to bartleby experts…
Q: Question 2 Licensed Nuclear Reactors The data show the number of licensed nuclear reactors in…
A:
Q: A consignment of 180 articles is classified according to the size of the article as under. Find the…
A: Since you have asked multiple questions, we will solve the first question for you. If you want any…
Q: JESTION 12 era manufacturer claims that it takes, on average, 76 minutes of continuous recording for…
A: Given that Population mean μ =76
Q: X~N (7.5,2.5) Find the probability that x is between three and nine.
A: For such problems we use z score for calculating probability. we can finx the z score at 3 and 9 and…
Q: diagnoses. The (incomplete) results are shown below: # of times floss per week 0 1 2 3 4 Frequency…
A:
Q: which of the following would be expected to result in a larger standard error of the mean? (a) a…
A:
Q: Find the required sample size without making a guess for the observed value of p. A computer…
A: Given info: Confidence level = 0.95 and E = 0.032. Consider p^=0.5 as there is no guess.
Q: How can we interpret a 95% confidence interval?
A: How to interpret a 95% confidence Interval? We know that, Confidence Interval is defined as the…
Q: The amount of time a certain brand of light bulb lasts is normally distributed with a mean of 1200…
A: Let X denote the amount of time a certain brand of light bulb lasts. Given that X follows N(mean =…
Q: At a drug rehab center 40% experience depression and 28% experience weight gain. 14% experience…
A: As per our guidelines I can solve only first 3 subparts. Post the remaining subparts again and…
Q: Identify the lower class limits, upper class limits, class width, class midpoints, and class…
A: Concept: Upper class limit is the higher value of limit. Lower class limit is the lower value of the…
Q: It has been determined that 37 out of 100 adult Americans that did not attend college believe in…
A: There are two independent samples which follows normal distribution. We have to test whether the…
Q: The amount of time that people spend at Grover Hot Springs is normally distributed with a mean of 65…
A: Given that Mean = M = 65 Standard deviation = SD = 17 X = the amount of the person at Grover Hot…
Q: Consider the following hypotheses statement for the average life span of a laptop battery: Ho: p= 4…
A: It is given that Sample size n = 60 Sample mean = 4.1 Population SD = 0.3
Q: A car believes that the percentage of citizens in city ABC that owns a vehicle is 60% or less. A…
A: Given information- Population proportion, p = 0.60 Sample size, n = 250 Significance level, α = 0.1
Q: If the consequences of making a Type I error are severe, would you choose the level of significance,…
A: It has been stated that, committing a type-I error is severe. And the significance level is to be…
Q: red 5.00 7 A study was conducted to check which vehicles come to a complete stop at an intersection…
A: We will use Chi- squared test for testing the hypothesis that the two variables are related. For…
Q: A study is conducted to investiage the prevalnce of arthritis in the Canadian adult population. In…
A: A) Suppose p as the true proportion of Canadian adults who have arthritis.
Q: Consider the following hypotheses statement for the average cost of a computer part: Ho: 56, Hap>…
A: Given that x̄ = 58 , μ = 56 , ? = 6 , n = 70
Q: Among fatal plane crashes that occurred during the past 60 years, 580 were due to pilot error, 52…
A: The given data is Cause Frequency Pilot error 580 Other human error 52 Weather 169…
Q: An insurance company calculates car insurance company calculates car insurance premiums based on the…
A:
Q: Test the claim that the proportion of people who own cats is larger than 20% at the 0.01…
A: Given population proportion p=20%=0.20 , level of significance ɑ=0.01, n=700, p^=27% =0.27
Q: c. The test statistic z v d. The p-value = e. The p-value is ≤ v a = 2.768 X (please show your…
A: Given that n = 337 , X = 24 , p = 12% = 0.12
Q: c. The test statistic d. The p-value = v = 1.933 x (please show your answer to 3 decimal places.)…
A: Given that Sample size n =393 Favorable cases x =94
Q: Based upon the output provided, what is sample size?
A: Given information : Correlation Matrix for the variables Travel and Satisfaction is given.
Q: A pharmaceutical company has developed a new flu vaccine. To test its effectiveness, the company…
A: Given that: A new flue vaccine is created by the company and to test its effectiveness it enlist…
Q: A long-distance phone company wishes to estimate the mean duration of long-distance calls…
A: Data given n=15 Data: 5,5,2,5,5,17,21,29,31,13,1,19,12,2,37
Q: 2) Let X₁, X₂, X3, X4 be a random sample of size 4 from a population with the following distribution…
A: Pdf given f(X)=1/βe-(x-4)/β x>4 n=4
Q: The number of emails sent by a teacher during weekend is an example of continuous variable Discrete…
A:

Step by step
Solved in 3 steps with 1 images

- Find the equation of the regression line for the following data set. x 1 2 3 y 0 3 4The following fictitious table shows kryptonite price, in dollar per gram, t years after 2006. t= Years since 2006 0 1 2 3 4 5 6 7 8 9 10 K= Price 56 51 50 55 58 52 45 43 44 48 51 Make a quartic model of these data. Round the regression parameters to two decimal places.Olympic Pole Vault The graph in Figure 7 indicates that in recent years the winning Olympic men’s pole vault height has fallen below the value predicted by the regression line in Example 2. This might have occurred because when the pole vault was a new event there was much room for improvement in vaulters’ performances, whereas now even the best training can produce only incremental advances. Let’s see whether concentrating on more recent results gives a better predictor of future records. (a) Use the data in Table 2 (page 176) to complete the table of winning pole vault heights shown in the margin. (Note that we are using x=0 to correspond to the year 1972, where this restricted data set begins.) (b) Find the regression line for the data in part ‚(a). (c) Plot the data and the regression line on the same axes. Does the regression line seem to provide a good model for the data? (d) What does the regression line predict as the winning pole vault height for the 2012 Olympics? Compare this predicted value to the actual 2012 winning height of 5.97 m, as described on page 177. Has this new regression line provided a better prediction than the line in Example 2?
- Use the following linear regression equation to answer the questions. x1 = 1.5 + 3.6x2 – 7.8x3 + 1.8x4 (c) If x2 = 10, x3 = 7, and x4 = 7, what is the predicted value for x1? (Use 1 decimal place.) answer: -4.5 Suppose x3 and x4 were held at fixed but arbitrary values and x2 increased by 1 unit. What would be the corresponding change in x1? answer:3.6 Suppose x2 increased by 2 units. What would be the expected change in x1? answer: 7.2 Suppose x2 decreased by 4 units. What would be the expected change in x1? (e) Suppose that n = 13 data points were used to construct the given regression equation and that the standard error for the coefficient of x2 is 0.461. Construct a 95% confidence interval for the coefficient of x2. (Use 2 decimal places.) lower limit upper limit (f) Using the information of part (e) and level of significance 1%, test the claim that the coefficient of x2 is different from zero. (Use 2 decimal places.) t 7.81 t critical ±Use the following linear regression equation to answer the questions. x3 = −17.3 + 4.1x1 + 9.6x4 − 1.6x7 Suppose x1 and x7 were held at fixed but arbitrary values. a) If x4 increased by 1 unit, what would we expect the corresponding change in x3 to be? b) If x4 increased by 3 units, what would be the corresponding expected change in x3? c) If x4 decreased by 2 units, what would we expect for the corresponding change in x3?Use the following linear regression equation to answer the questions. x3 = −15.4 + 4.0x1 + 8.2x4 − 1.2x7 (d)Suppose x1 and x7 were held at fixed but arbitrary values.If x4 increased by 1 unit, what would we expect the corresponding change in x3 to be?If x4 increased by 3 units, what would be the corresponding expected change in x3?If x4 decreased by 2 units, what would we expect for the corresponding change in x3?(e) Suppose that n = 14 data points were used to construct the given regression equation and that the standard error for the coefficient of x4 is 0.917. Construct a 90% confidence interval for the coefficient of x4. (Round your answers to two decimal places.) lower limit upper limit (f) Using the information of part (e) and level of significance 5%, test the claim that the coefficient of x4 is different from zero. (Round your answers to two decimal places.) t = t critical = ±
- Use the following linear regression equation to answer the questions. X1=1.9+3.6x2-7.5x3+2.1x4 a) which number is the constant term? List the coefficients with their corresponding explanatory variables. constant=x2 coefficient =x3 coefficient =x4 coefficient =b) If x3 and x4 were held at fixed but arbitrary values and x2 increased by 1 unit. What would be the corresponding change in x1? suppose x2 increased by 2 units. What would be the expected change in x1? suppose x2 decreased by 4 units. What would be the expected change in x1? c) Suppose that n=13 data points were used to construct the given regression equation and that the standard error for the coefficient of x2 is 0.433. Construct a 95% confidence interval for the coefficient of x2. (Use 2 decimal places)Use the following linear regression equation to answer the questions. x1 = 2.0 + 3.6x2 – 7.8x3 + 2.1x4 a) Which variables are the explanatory variables? (Select all that apply.) x3 x1 x2 x4 (b) Which number is the constant term? List the coefficients with their corresponding explanatory variables. constant _____ x2 coefficient _____ x3 coefficient _____ x4 coefficient ______ (c) If x2 = 9, x3 = 3, and x4 = 6, what is the predicted value for x1? (Use 1 decimal place.)Use the following linear regression equation to answer the questions. x1 = 1.5 + 3.6x2 – 7.8x3 + 1.8x4 Which variables are the explanatory variables? (Select all that apply.) x4x3x2x1 (c) If x2 = 10, x3 = 7, and x4 = 7, what is the predicted value for x1? (Use 1 decimal place.)Suppose x3 and x4 were held at fixed but arbitrary values and x2 increased by 1 unit. What would be the corresponding change in x1?Suppose x2 increased by 2 units. What would be the expected change in x1?Suppose x2 decreased by 4 units. What would be the expected change in x1?(e) Suppose that n = 13 data points were used to construct the given regression equation and that the standard error for the coefficient of x2 is 0.461. Construct a 95% confidence interval for the coefficient of x2. (Use 2 decimal places.) lower limit upper limit (f) Using the information of part (e) and level of significance 1%, test the claim that the coefficient of x2 is different from zero. (Use 2 decimal places.) t t…
- Use the following linear regression equation to answer the questions. x3 = −15.4 + 4.0x1 + 8.2x4 − 1.2x (a) Which variables are the explanatory variables? (Select all that apply.) x4 x3 x7 x1 (b) Which number is the constant term? List the coefficients with their corresponding explanatory variables. constant x1 coefficient x4 coefficient x7 coefficient (c) If x1 = 9, x4 = -5, and x7 = 4, what is the predicted value for x3? (Round your answer to one decimal place.)x3 =Suppose that in a certain chemical process the reaction time y (hr) is related to the temperature (°F) in the chamber in which the reaction takes place according to the simple linear regression model with equation y = 5.10 − 0.01x and ? = 0.07. (a) What is the expected change in reaction time for a 1°F increase in temperature? For a 12°F increase in temperature? 1°F increase hr 12°F increase hr (b) What is the expected reaction time when temperature is 190°F? When temperature is 240°F? 190°F hr 240°F hr (c) Suppose five observations are made independently on reaction time, each one for a temperature of 240°F. What is the probability that all five times are between 2.58 and 2.82 hours? (Round your answer to four decimal places.)(d) What is the probability that two independently observed reaction times for temperatures 1° apart are such that the time at the higher temperature exceeds the time at the lower temperature? (Round your answer to four decimal…5. In simple linear regression: a.The larger the coefficient of determination, then the more precisely the y variable can be predicted from the x variable. b.The larger the coefficient of determination, then the less precisely the y variable can be predicted from the x variable. c.Neither of the above. d.Both of the above.


