3. Researchers wanted to determine if carpeted rooms contained more bacteria thàn uncarpeted rooms. To determine the amount of bacteria in a room, researchers pumped the from the room over a Petri dish at the rate of 1 cubic foot per minute for eight carpeted roon and eight uncarpeted rooms. Colonies of bacteria were allowed to form in the 16 Petri dishes The results are presented in the table below. A normal probability plot and boxplot indicate that the data are approximately normally distributed with no outliers. Do carpeted rooms have MORE bacteria than uncarpeted rooms at the a = 0.05 level of significance? Carpeted Rooms (bacteria/cubic foot) 11.8 8.2 7.1 13.0 Uncarpeted Rooms (bacteria/cubic foot) 12.0 10.8 10.1 14.6 12.1 8.3 3.8 7.2 11.1 10.1 14.0 13.7
3. Researchers wanted to determine if carpeted rooms contained more bacteria thàn uncarpeted rooms. To determine the amount of bacteria in a room, researchers pumped the from the room over a Petri dish at the rate of 1 cubic foot per minute for eight carpeted roon and eight uncarpeted rooms. Colonies of bacteria were allowed to form in the 16 Petri dishes The results are presented in the table below. A normal probability plot and boxplot indicate that the data are approximately normally distributed with no outliers. Do carpeted rooms have MORE bacteria than uncarpeted rooms at the a = 0.05 level of significance? Carpeted Rooms (bacteria/cubic foot) 11.8 8.2 7.1 13.0 Uncarpeted Rooms (bacteria/cubic foot) 12.0 10.8 10.1 14.6 12.1 8.3 3.8 7.2 11.1 10.1 14.0 13.7
Holt Mcdougal Larson Pre-algebra: Student Edition 2012
1st Edition
ISBN:9780547587776
Author:HOLT MCDOUGAL
Publisher:HOLT MCDOUGAL
Chapter11: Data Analysis And Probability
Section: Chapter Questions
Problem 8CR
Related questions
Question
needed help

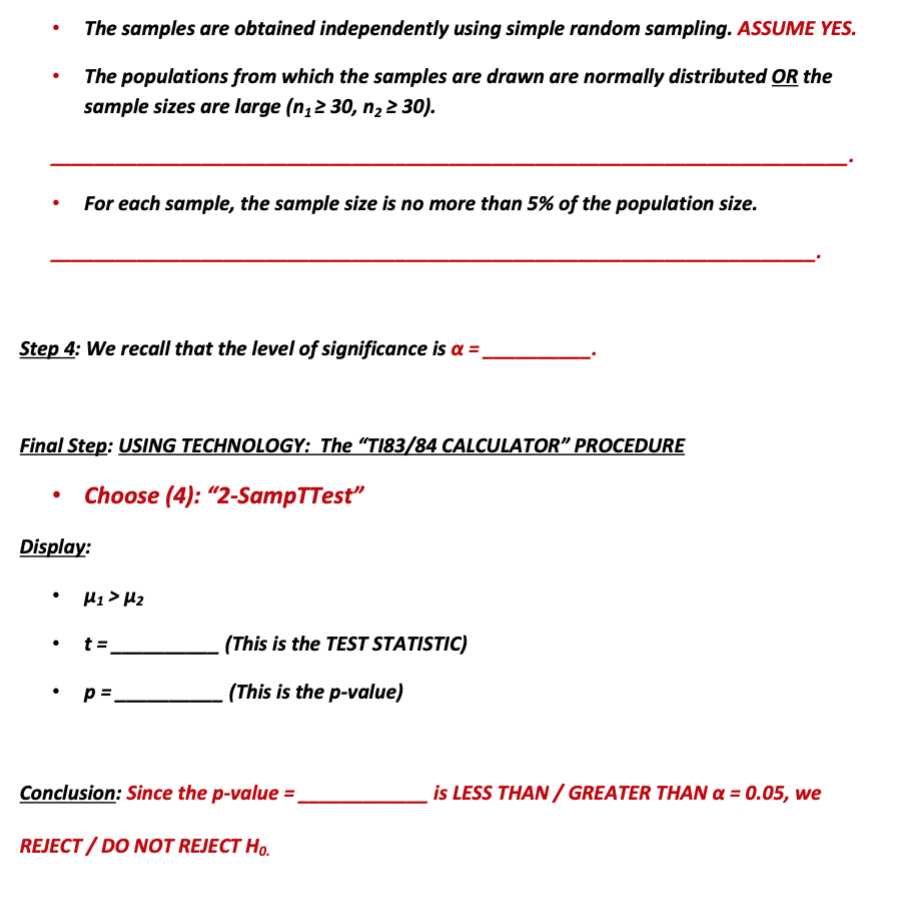
Transcribed Image Text:The samples are obtained independently using simple random sampling. ASSUME YES.
The populations from which the samples are drawn are normally distributed OR the
sample sizes are large (n,2 30, n, 2 30).
For each sample, the sample size is no more than 5% of the population size.
Step 4: We recall that the level of significance is a =
Final Step: USING TECHNOLOGY: The “TI83/84 CALCULATOR" PROCEDURE
Choose (4): “2-SampTTest"
Display:
H1 > Hz
t =
(This is the TEST STATISTIC)
p =.
. (This is the p-value)
Conclusion: Since the p-value =.
is LESS THAN / GREATER THAN a = 0.05, we
REJECT / DO NOT REJECT Ho.

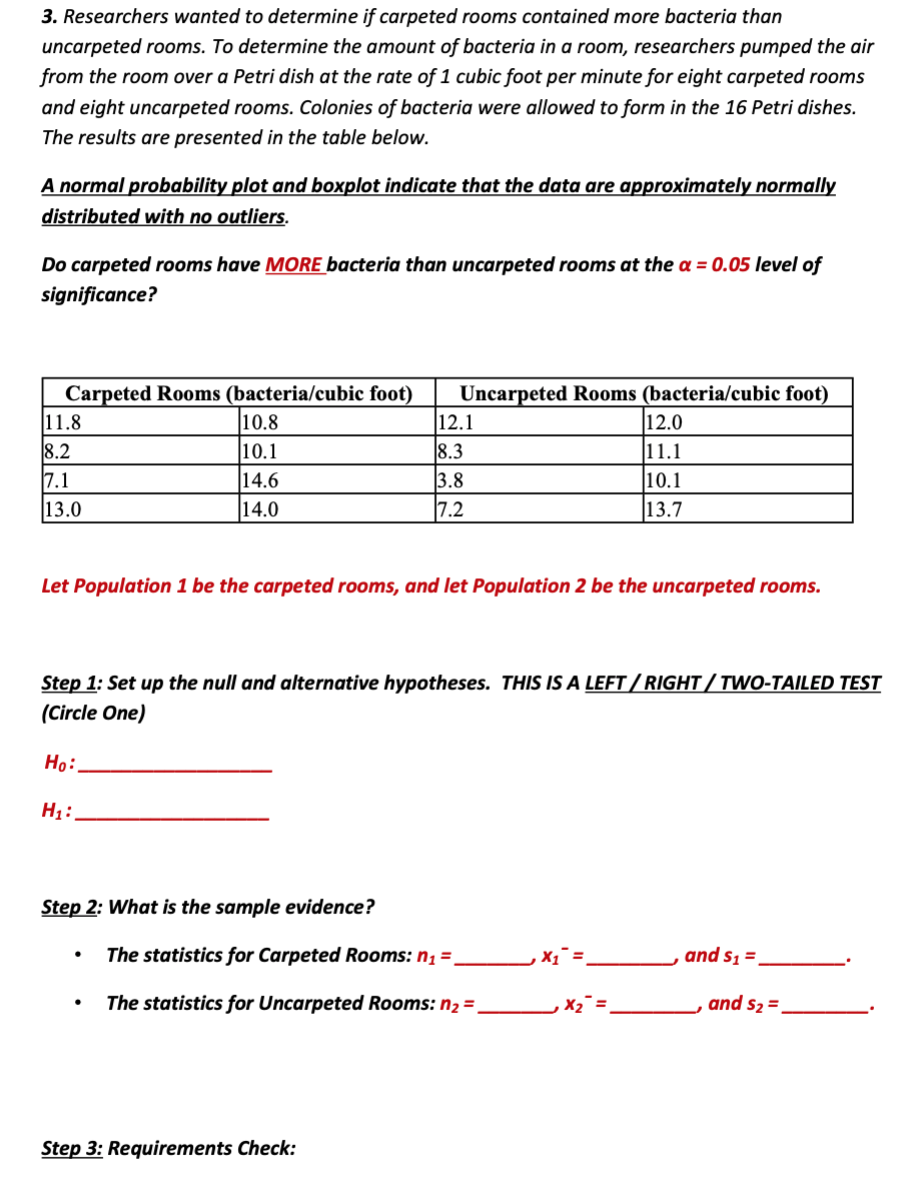
Transcribed Image Text:3. Researchers wanted to determine if carpeted rooms contained more bacteria than
uncarpeted rooms. To determine the amount of bacteria in a room, researchers pumped the air
from the room over a Petri dish at the rate of 1 cubic foot per minute for eight carpeted rooms
and eight uncarpeted rooms. Colonies of bacteria were allowed to form in the 16 Petri dishes.
The results are presented in the table below.
A normal probability plot and boxplot indicate that the data are approximately normally
distributed with no outliers.
Do carpeted rooms have MORE bacteria than uncarpeted rooms at the a = 0.05 level of
significance?
Carpeted Rooms (bacteria/cubic foot)
11.8
Uncarpeted Rooms (bacteria/cubic foot)
12.1
8.3
3.8
7.2
10.8
12.0
8.2
10.1
11.1
7.1
13.0
14.6
10.1
14.0
13.7
Let Population 1 be the carpeted rooms, and let Population 2 be the uncarpeted rooms.
Step 1: Set up the null and alternative hypotheses. THIS IS A LEFT / RIGHT/TWO-TAILED TEST
(Circle One)
Ho:.
Step 2: What is the sample evidence?
The statistics for Carpeted Rooms: n1 =
and s1 =
The statistics for Uncarpeted Rooms: n2 =
, X2¯ =
and s2 =
Step 3: Requirements Check:
Expert Solution
This question has been solved!
Explore an expertly crafted, step-by-step solution for a thorough understanding of key concepts.
This is a popular solution!
Trending now
This is a popular solution!
Step by step
Solved in 2 steps with 3 images

Knowledge Booster
Learn more about
Need a deep-dive on the concept behind this application? Look no further. Learn more about this topic, calculus and related others by exploring similar questions and additional content below.Recommended textbooks for you

Holt Mcdougal Larson Pre-algebra: Student Edition…
Algebra
ISBN:
9780547587776
Author:
HOLT MCDOUGAL
Publisher:
HOLT MCDOUGAL


Holt Mcdougal Larson Pre-algebra: Student Edition…
Algebra
ISBN:
9780547587776
Author:
HOLT MCDOUGAL
Publisher:
HOLT MCDOUGAL
