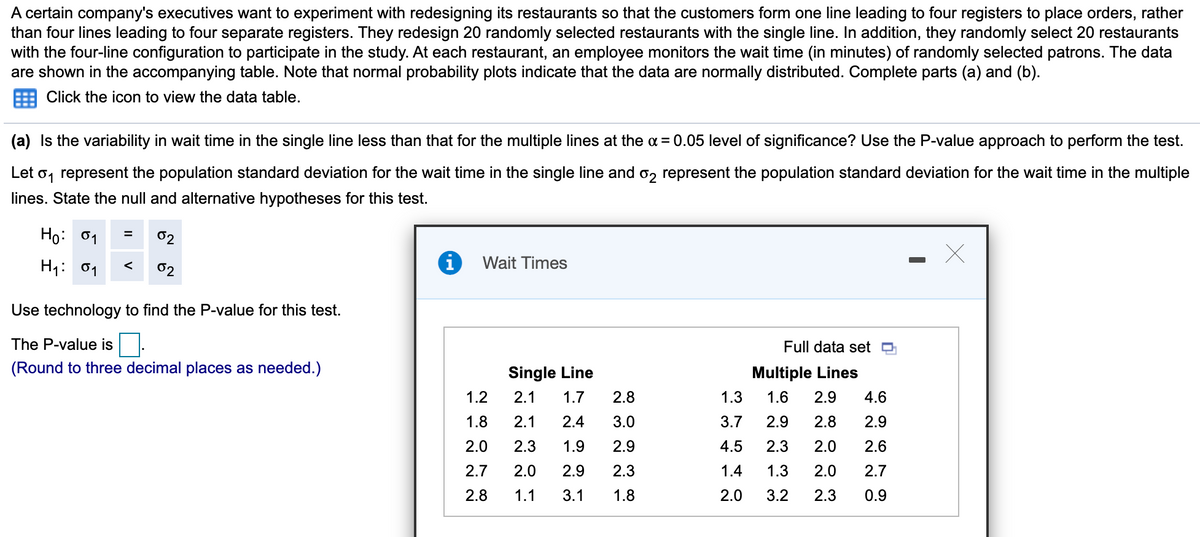
A certain company's executives want to experiment with redesigning its restaurants so that the customers form one line leading to four registers to place orders, rather than four lines leading to four separate registers. They redesign 20 randomly selected restaurants with the single line. In addition, they randomly select 20 restaurants with the four-line configuration to participate in the study. At each restaurant, an employee monitors the wait time (in minutes) of randomly selected patrons. The data are shown in the accompanying table. Note that normal probability plots indicate that the data are normally distributed. Complete parts (a) and (b). E Click the icon to view the data table. (a) Is the variability in wait time in the single line less than that for the multiple lines at the a = 0.05 level of significance? Use the P-value approach to perform the test. Let o, represent the population standard deviation for the wait time in the single line and o, represent the population standard deviation for the wait time in the multiple lines. State the null and alternative hypotheses for this test. Họ: 01 02 H1: 01 02 Wait Times Use technology to find the P-value for this test. The P-value is Full data set O (Round to three decimal places as needed.) Single Line Multiple Lines 1.2 2.1 1.7 2.8 1.3 1.6 2.9 4.6 1.8 2.1 2.4 3.0 3.7 2.9 2.8 2.9 2.0 2.3 1.9 2.9 4.5 2.3 2.0 2.6 2.7 2.0 2.9 2.3 1.4 1.3 2.0 2.7 2.8 1.1 3.1 1.8 2.0 3.2 2.3 0.9
A certain company's executives want to experiment with redesigning its restaurants so that the customers form one line leading to four registers to place orders, rather than four lines leading to four separate registers. They redesign 20 randomly selected restaurants with the single line. In addition, they randomly select 20 restaurants with the four-line configuration to participate in the study. At each restaurant, an employee monitors the wait time (in minutes) of randomly selected patrons. The data are shown in the accompanying table. Note that normal probability plots indicate that the data are normally distributed. Complete parts (a) and (b). E Click the icon to view the data table. (a) Is the variability in wait time in the single line less than that for the multiple lines at the a = 0.05 level of significance? Use the P-value approach to perform the test. Let o, represent the population standard deviation for the wait time in the single line and o, represent the population standard deviation for the wait time in the multiple lines. State the null and alternative hypotheses for this test. Họ: 01 02 H1: 01 02 Wait Times Use technology to find the P-value for this test. The P-value is Full data set O (Round to three decimal places as needed.) Single Line Multiple Lines 1.2 2.1 1.7 2.8 1.3 1.6 2.9 4.6 1.8 2.1 2.4 3.0 3.7 2.9 2.8 2.9 2.0 2.3 1.9 2.9 4.5 2.3 2.0 2.6 2.7 2.0 2.9 2.3 1.4 1.3 2.0 2.7 2.8 1.1 3.1 1.8 2.0 3.2 2.3 0.9

Linear Algebra: A Modern Introduction
4th Edition
ISBN:9781285463247
Author:David Poole
Publisher:David Poole
Chapter7: Distance And Approximation
Section7.3: Least Squares Approximation
Problem 31EQ

Related questions

Question
Transcribed Image Text:A certain company's executives want to experiment with redesigning its restaurants so that the customers form one line leading to four registers to place orders, rather
than four lines leading to four separate registers. They redesign 20 randomly selected restaurants with the single line. In addition, they randomly select 20 restaurants
with the four-line configuration to participate in the study. At each restaurant, an employee monitors the wait time (in minutes) of randomly selected patrons. The data
are shown in the accompanying table. Note that normal probability plots indicate that the data are normally distributed. Complete parts (a) and (b).
Click the icon to view the data table.
(a) Is the variability in wait time in the single line less than that for the multiple lines at the a = 0.05 level of significance? Use the P-value approach to perform the test.
Let
o, represent the population standard deviation for the wait time in the single line and o, represent the population standard deviation for the wait time in the multiple
lines. State the null and alternative hypotheses for this test.
Họ: 01
02
H1: 01
02
Wait Times
Use technology to find the P-value for this test.
The P-value is
Full data set o
(Round to three decimal places as needed.)
Single Line
Multiple Lines
1.2
2.1
1.7
2.8
1.3
1.6
2.9
4.6
1.8
2.1
2.4
3.0
3.7
2.9
2.8
2.9
2.0
2.3
1.9
2.9
4.5
2.3
2.0
2.6
2.7
2.0
2.9
2.3
1.4
1.3
2.0
2.7
2.8
1.1
3.1
1.8
2.0
3.2
2.3
0.9
Expert Solution
This question has been solved!
Explore an expertly crafted, step-by-step solution for a thorough understanding of key concepts.

This is a popular solution!

Trending now
This is a popular solution!

Step by step
Solved in 4 steps with 4 images

Knowledge Booster


Learn more about
Need a deep-dive on the concept behind this application? Look no further. Learn more about this topic, statistics and related others by exploring similar questions and additional content below.Recommended textbooks for you
Linear Algebra: A Modern Introduction
Algebra
ISBN:
9781285463247
Author:
David Poole
Publisher:
Cengage Learning

Glencoe Algebra 1, Student Edition, 9780079039897…
Algebra
ISBN:
9780079039897
Author:
Carter
Publisher:
McGraw Hill

Holt Mcdougal Larson Pre-algebra: Student Edition…
Algebra
ISBN:
9780547587776
Author:
HOLT MCDOUGAL
Publisher:
HOLT MCDOUGAL
Linear Algebra: A Modern Introduction
Algebra
ISBN:
9781285463247
Author:
David Poole
Publisher:
Cengage Learning
Glencoe Algebra 1, Student Edition, 9780079039897…
Algebra
ISBN:
9780079039897
Author:
Carter
Publisher:
McGraw Hill
Holt Mcdougal Larson Pre-algebra: Student Edition…
Algebra
ISBN:
9780547587776
Author:
HOLT MCDOUGAL
Publisher:
HOLT MCDOUGAL
Expert Answers to Latest Homework Questions
Q: phy.
Q: Canvas
Study Area
insideWheaton
Document Sharing
User Settings
Consider the circuit shown in (Figure…
Q: Costs per Equivalent Unit
The following information concerns production in the Baking Department for…
Q: Prior to the 2007–2009 financial crisis, the most frequently employed monetary policy tool was…
Q: am. 128.
Q: am. 1222
Q: am. 127.
Q: am. 125.
Q: Reflecting on the concepts of dynamic
glazing and shading devices, discuss a
real-world specific…
Q: 3. For this system, the probability of each task being successful is 0.8. What is the probability of…
Q: hf.3
Q: nku.3
Q: go.0
Q: None
Q: VIOUS ANSWERS
ASK YOUR TEACHER
PRACTICE ANOTHER
A piece of insulated wire is shaped into a figure…
Q: un.3
Q: None
Q: None
Q: The management of Unter Corporation, an architectural design firm, is considering an
investment with…
Q: None
Q: What second messenger does NOT cause a cascade of phosphorylation to elicit a response from the…