3. The bar chart below shows the top 10states where refugees are resettled from fiscal years of 2002 to 2017. a. Summarize what you see in this chart in at least 3 sentences. b. Suppose there were 523,000 refugee arrivals during this time period. Calculate the percentage of refugees (to the nearest 10th percent) resettled into each of these top 10resettlement states. Must show calculations/formula for credit. Any answer given with no calculations shown will result in no credit for that answer.
3. The bar chart below shows the top 10states where refugees are resettled from fiscal years of 2002 to 2017. a. Summarize what you see in this chart in at least 3 sentences. b. Suppose there were 523,000 refugee arrivals during this time period. Calculate the percentage of refugees (to the nearest 10th percent) resettled into each of these top 10resettlement states. Must show calculations/formula for credit. Any answer given with no calculations shown will result in no credit for that answer.

Chapter9: Sequences, Probability And Counting Theory
Section9.5: Counting Principles
Problem 43SE: A wholesale T-shirt company oilers sizes small, medium, large, and extra-large in organic or non-...

Related questions
Question
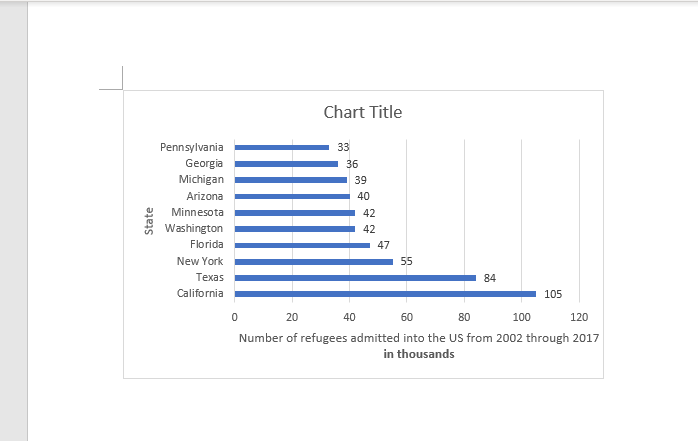
Transcribed Image Text:Chart Title
Pennsylvania
33
Georgia
36
Michigan
39
Arizona
40
Minnesota
42
Washington
42
Florida
47
New York
55
Техas
84
California
105
20
40
60
80
100
120
Number of refugees admitted into the US from 2002 through 2017
in thousands
State
Transcribed Image Text:3. The bar chart below shows the top 10 states where refugees are resettled from fiscal
years of 2002 to 2017.
a. Summarize what you see in this chart in at least 3 sentences.
b. Suppose there were 523,000 refugee arrivals during this time period. Calculate the
percentage of refugees (to the nearest 10th percent) resettled into each of these
top 10resettlement states. Must show calculations/formula for credit. Any
answer given with no calculations shown will result in no credit for that answer.
Expert Solution
This question has been solved!
Explore an expertly crafted, step-by-step solution for a thorough understanding of key concepts.

This is a popular solution!

Trending now
This is a popular solution!

Step by step
Solved in 2 steps with 1 images

Recommended textbooks for you