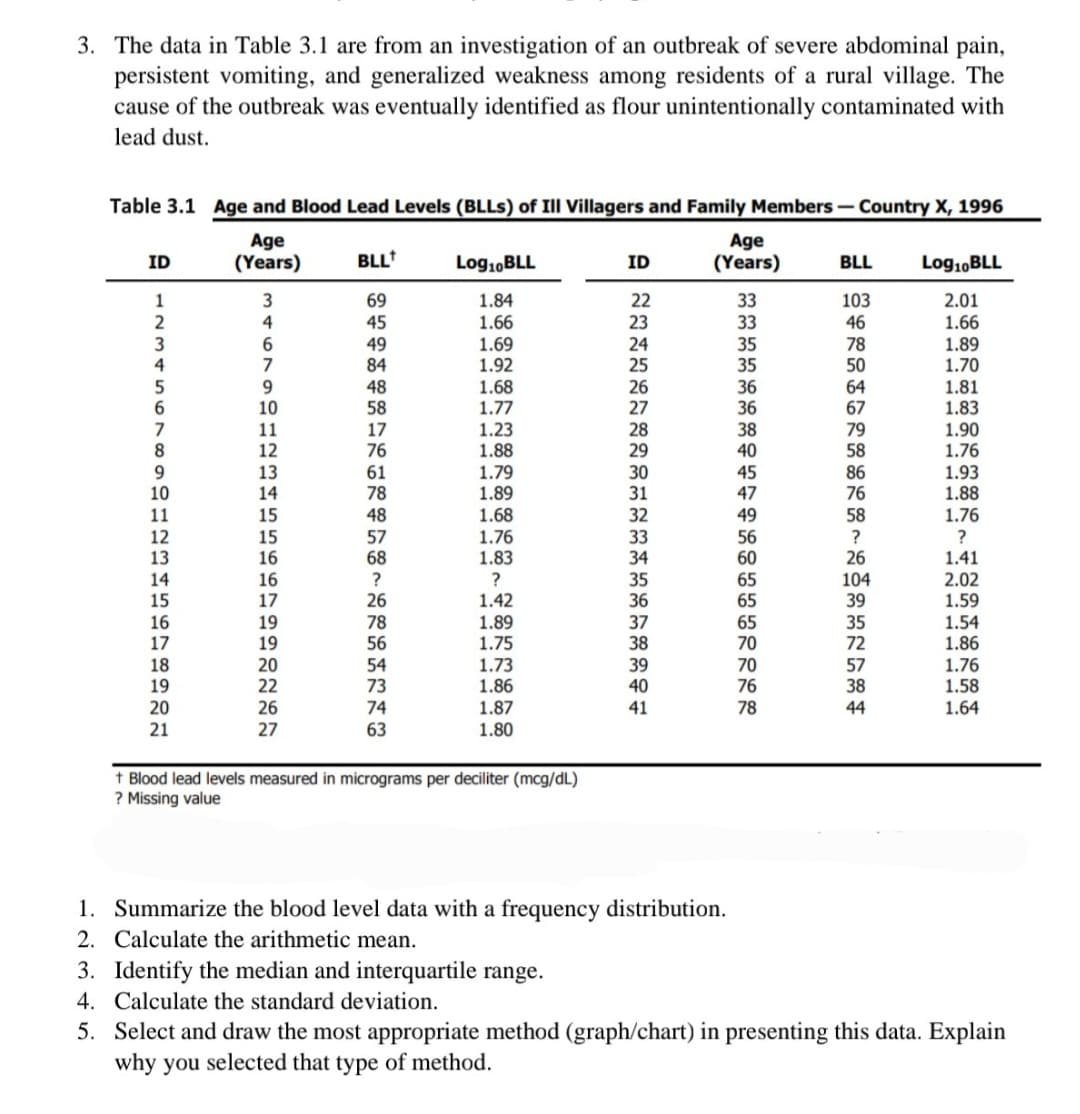
3. The data in Table 3.1 are from an investigation of an outbreak of severe abdominal pain, persistent vomiting, and generalized weakness among residents of a rural village. The cause of the outbreak was eventually identified as flour unintentionally contaminated with lead dust. Table 3.1 Age and Blood Lead Levels (BLLS) of Ill Villagers and Family Members-Country X, 1996 Age (Years) Age (Years) ID BLL Log1,BLL ID BLL Log1,BLL 3 69 1.84 1.66 1.69 1.92 22 33 33 103 2.01 1.66 1 4 45 23 46 49 84 48 58 24 25 26 27 35 35 36 36 38 40 78 50 1.89 1.70 1.81 1.83 1.90 1.76 4 7 9. 10 1.68 1.77 1.23 1.88 64 67 79 58 7 11 12 17 76 28 29 13 14 1.79 1.89 61 78 48 57 68 30 31 32 33 34 35 36 45 47 86 76 58 1.93 1.88 1.76 ? 1.41 10 11 12 13 15 1.68 49 15 16 16 17 1.76 1.83 56 60 65 65 65 70 26 104 39 2.02 1.59 1.54 1.86 1.76 1.58 1.64 14 15 26 78 56 54 73 ? 1.42 1.89 1.75 16 17 19 19 20 22 26 37 38 39 40 35 72 18 19 20 1.73 1.86 1.87 1.80 70 76 78 57 38 74 41 44 21 27 63 t Blood lead levels measured in micrograms per deciliter (mcg/dL) ? Missing value 1. Summarize the blood level data with a frequency distribution. 2. Calculate the arithmetic mean. 3. Identify the median and interquartile range. 4. Calculate the standard deviation. 5. Select and draw the most appropriate method (graph/chart) in presenting this data. Explain why you selected that type of method.
3. The data in Table 3.1 are from an investigation of an outbreak of severe abdominal pain, persistent vomiting, and generalized weakness among residents of a rural village. The cause of the outbreak was eventually identified as flour unintentionally contaminated with lead dust. Table 3.1 Age and Blood Lead Levels (BLLS) of Ill Villagers and Family Members-Country X, 1996 Age (Years) Age (Years) ID BLL Log1,BLL ID BLL Log1,BLL 3 69 1.84 1.66 1.69 1.92 22 33 33 103 2.01 1.66 1 4 45 23 46 49 84 48 58 24 25 26 27 35 35 36 36 38 40 78 50 1.89 1.70 1.81 1.83 1.90 1.76 4 7 9. 10 1.68 1.77 1.23 1.88 64 67 79 58 7 11 12 17 76 28 29 13 14 1.79 1.89 61 78 48 57 68 30 31 32 33 34 35 36 45 47 86 76 58 1.93 1.88 1.76 ? 1.41 10 11 12 13 15 1.68 49 15 16 16 17 1.76 1.83 56 60 65 65 65 70 26 104 39 2.02 1.59 1.54 1.86 1.76 1.58 1.64 14 15 26 78 56 54 73 ? 1.42 1.89 1.75 16 17 19 19 20 22 26 37 38 39 40 35 72 18 19 20 1.73 1.86 1.87 1.80 70 76 78 57 38 74 41 44 21 27 63 t Blood lead levels measured in micrograms per deciliter (mcg/dL) ? Missing value 1. Summarize the blood level data with a frequency distribution. 2. Calculate the arithmetic mean. 3. Identify the median and interquartile range. 4. Calculate the standard deviation. 5. Select and draw the most appropriate method (graph/chart) in presenting this data. Explain why you selected that type of method.

Functions and Change: A Modeling Approach to College Algebra (MindTap Course List)
6th Edition
ISBN:9781337111348
Author:Bruce Crauder, Benny Evans, Alan Noell
Publisher:Bruce Crauder, Benny Evans, Alan Noell
Chapter5: A Survey Of Other Common Functions
Section5.3: Modeling Data With Power Functions
Problem 6E: Urban Travel Times Population of cities and driving times are related, as shown in the accompanying...

Related questions
Question
Answer only 4 and 5
FOLLOW THE INSTRUCTIONS
TYPEWRITTEN ONLY PLEASE FOR UPVOTE. DOWNVOTE FOR HANDWRITTEN. DO NOT ANSWER IF YOU ALREADY ANSWERED THIS
Transcribed Image Text:3. The data in Table 3.1 are from an investigation of an outbreak of severe abdominal pain,
persistent vomiting, and generalized weakness among residents of a rural village. The
cause of the outbreak was eventually identified as flour unintentionally contaminated with
lead dust.
Table 3.1 Age and Blood Lead Levels (BLLS) of Ill Villagers and Family Members - Country X, 1996
Age
(Years)
Age
(Years)
ID
BLL
Log1,BLL
ID
BLL
Log1,BLL
1.84
1.66
1.69
1.92
69
45
22
33
33
103
46
78
50
2.01
1.66
1.89
1.70
1.81
1.83
2
4
23
49
84
24
25
26
27
28
29
35
35
4
7
1.68
1.77
1.23
1.88
1.79
1.89
1.68
1.76
1.83
9.
10
48
58
36
36
38
40
64
67
79
58
86
76
6.
7
1.90
1.76
1.93
1.88
1.76
11
17
12
76
9
10
13
14
61
78
30
31
45
47
11
15
48
32
33
34
35
36
49
58
?
26
104
39
12
13
15
16
16
17
57
68
56
60
65
65
65
70
1.41
2.02
1.59
1.54
1.86
1.76
1.58
1.64
?
26
14
15
16
17
1.42
1.89
1.75
19
19
78
56
37
38
39
40
35
72
18
19
20
21
20
22
26
54
73
1.73
1.86
70
76
57
38
74
1.87
41
78
44
27
63
1.80
t Blood lead levels measured in micrograms per deciliter (mcg/dL)
? Missing value
1. Summarize the blood level data with a frequency distribution.
2. Calculate the arithmetic mean.
3. Identify the median and interquartile range.
4. Calculate the standard deviation.
5. Select and draw the most appropriate method (graph/chart) in presenting this data. Explain
why you selected that type of method.
Expert Solution
This question has been solved!
Explore an expertly crafted, step-by-step solution for a thorough understanding of key concepts.

This is a popular solution!

Trending now
This is a popular solution!

Step by step
Solved in 3 steps with 1 images

Recommended textbooks for you
Functions and Change: A Modeling Approach to Coll…
Algebra
ISBN:
9781337111348
Author:
Bruce Crauder, Benny Evans, Alan Noell
Publisher:
Cengage Learning

Linear Algebra: A Modern Introduction
Algebra
ISBN:
9781285463247
Author:
David Poole
Publisher:
Cengage Learning
Functions and Change: A Modeling Approach to Coll…
Algebra
ISBN:
9781337111348
Author:
Bruce Crauder, Benny Evans, Alan Noell
Publisher:
Cengage Learning
Linear Algebra: A Modern Introduction
Algebra
ISBN:
9781285463247
Author:
David Poole
Publisher:
Cengage Learning