3. The data on the right were collected from a rocky shore field trip. Periwinkles from four common species of the genus Littorina were sampled in a continuous belt transect from the low water mark, to a height of 10 m above that level. The number of each of the four species in a 1 m² quadrat was recorded.
3. The data on the right were collected from a rocky shore field trip. Periwinkles from four common species of the genus Littorina were sampled in a continuous belt transect from the low water mark, to a height of 10 m above that level. The number of each of the four species in a 1 m² quadrat was recorded.

Applications and Investigations in Earth Science (9th Edition)
9th Edition
ISBN:9780134746241
Author:Edward J. Tarbuck, Frederick K. Lutgens, Dennis G. Tasa
Publisher:Edward J. Tarbuck, Frederick K. Lutgens, Dennis G. Tasa
Chapter1: The Study Of Minerals
Section: Chapter Questions
Problem 1LR

Related questions
Question
Transcribed Image Text:114
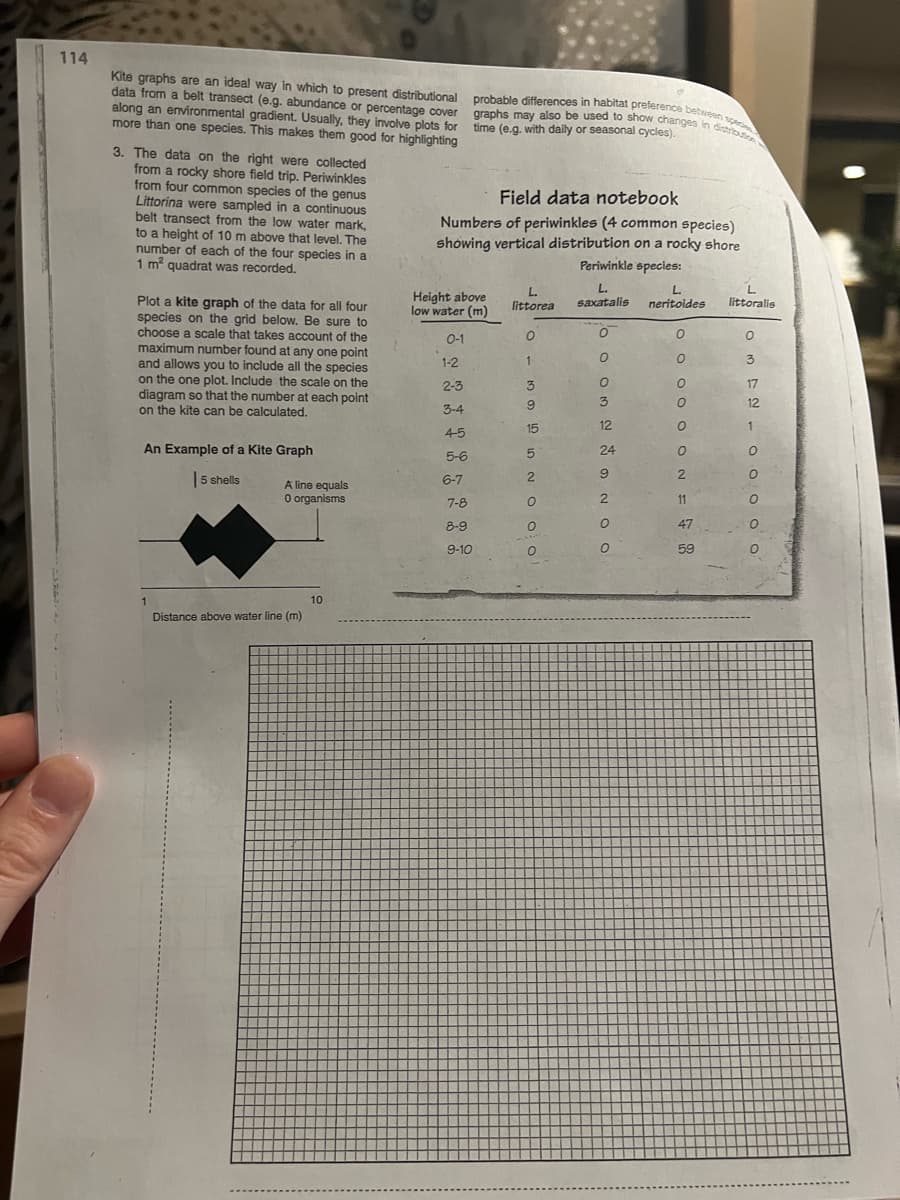
Kite graphs are an ideal way in which to present distributional probable differences in habitat preference between specie
graphs may also be used to show changes in distribution
data from a belt transect (e.g. abundance or percentage cover
along an environmental gradient. Usually, they involve plots for
more than one species. This makes them good for highlighting
time (e.g. with daily or seasonal cycles).
3. The data on the right were collected
from a rocky shore field trip. Periwinkles
from four common species of the genus
Littorina were sampled in a continuous
belt transect from the low water mark,
to a height of 10 m above that level. The
number of each of the four species in a
1 m² quadrat was recorded.
Plot a kite graph of the data for all four
species on the grid below. Be sure to
choose a scale that takes account of the
maximum number found at any one point
and allows you to include all the species
on the one plot. Include the scale on the
diagram so that the number at each point
on the kite can be calculated.
An Example of a Kite Graph
5 shells
1
A line equals
O organisms
Distance above water line (m)
10
Field data notebook
Numbers of periwinkles (4 common species)
showing vertical distribution on a rocky shore
Periwinkle species:
Height above
low water (m)
0-1
1-2
2-3
3-4
4-5
5-6
6-7
7-8
8-9
9-10
L.
littorea
O
1
NOS SNOOO
15
L.
saxatalis
O
O OM N NONOO
3
24
9
L.
L.
neritoides littoralis
0
O O O O ONE
2
47
59
ом А У - 0 0 0 0 0
O
17
12
Expert Solution
This question has been solved!
Explore an expertly crafted, step-by-step solution for a thorough understanding of key concepts.

This is a popular solution!

Trending now
This is a popular solution!

Step by step
Solved in 2 steps

Recommended textbooks for you
Applications and Investigations in Earth Science …
Earth Science
ISBN:
9780134746241
Author:
Edward J. Tarbuck, Frederick K. Lutgens, Dennis G. Tasa
Publisher:
PEARSON

Exercises for Weather & Climate (9th Edition)
Earth Science
ISBN:
9780134041360
Author:
Greg Carbone
Publisher:
PEARSON

Environmental Science
Earth Science
ISBN:
9781260153125
Author:
William P Cunningham Prof., Mary Ann Cunningham Professor
Publisher:
McGraw-Hill Education
Applications and Investigations in Earth Science …
Earth Science
ISBN:
9780134746241
Author:
Edward J. Tarbuck, Frederick K. Lutgens, Dennis G. Tasa
Publisher:
PEARSON
Exercises for Weather & Climate (9th Edition)
Earth Science
ISBN:
9780134041360
Author:
Greg Carbone
Publisher:
PEARSON
Environmental Science
Earth Science
ISBN:
9781260153125
Author:
William P Cunningham Prof., Mary Ann Cunningham Professor
Publisher:
McGraw-Hill Education

Earth Science (15th Edition)
Earth Science
ISBN:
9780134543536
Author:
Edward J. Tarbuck, Frederick K. Lutgens, Dennis G. Tasa
Publisher:
PEARSON

Environmental Science (MindTap Course List)
Earth Science
ISBN:
9781337569613
Author:
G. Tyler Miller, Scott Spoolman
Publisher:
Cengage Learning

Physical Geology
Earth Science
ISBN:
9781259916823
Author:
Plummer, Charles C., CARLSON, Diane H., Hammersley, Lisa
Publisher:
Mcgraw-hill Education,