3. The following are the measurements of the height ten men. weight of 66 68 76 71 70 Height (inches) 63 71 72 68 75 Weight (pounds) 145 158 156 148 163 155 153 158 150 154 (a) Calculate the correlation coefficient and show that it is significantly different from zero.
3. The following are the measurements of the height ten men. weight of 66 68 76 71 70 Height (inches) 63 71 72 68 75 Weight (pounds) 145 158 156 148 163 155 153 158 150 154 (a) Calculate the correlation coefficient and show that it is significantly different from zero.

Glencoe Algebra 1, Student Edition, 9780079039897, 0079039898, 2018
18th Edition
ISBN:9780079039897
Author:Carter
Publisher:Carter
Chapter4: Equations Of Linear Functions
Section4.5: Correlation And Causation
Problem 23PFA

Related questions
Question
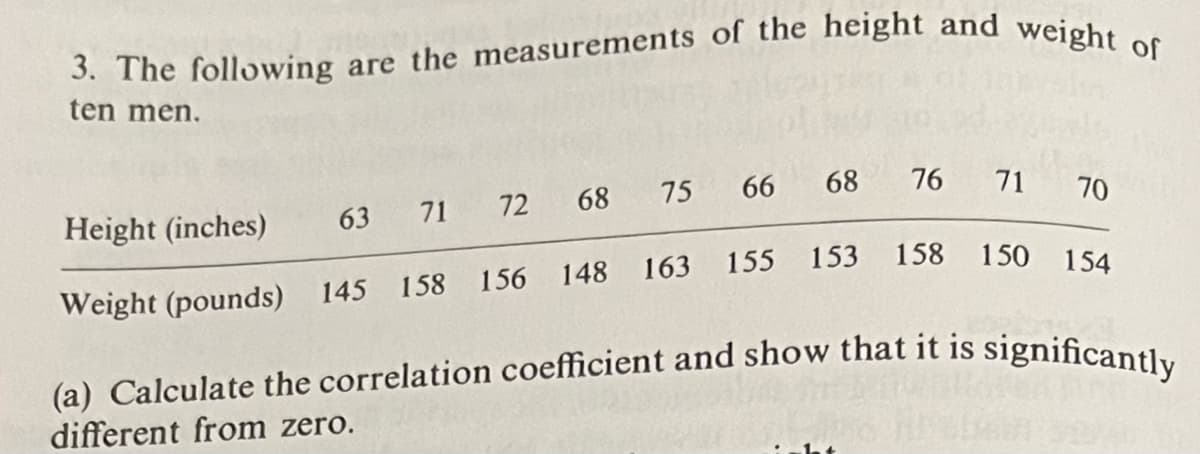
Transcribed Image Text:3. The following are the measurements of the height and weight of
ten men.
68 76 71 70
Height (inches)
63 71 72 68 75 66
Weight (pounds) 145 158 156 148 163 155 153 158 150 154
(a) Calculate the correlation coefficient and show that it is significantly
different from zero.
Expert Solution
This question has been solved!
Explore an expertly crafted, step-by-step solution for a thorough understanding of key concepts.

Step by step
Solved in 2 steps with 3 images

Recommended textbooks for you
Glencoe Algebra 1, Student Edition, 9780079039897…
Algebra
ISBN:
9780079039897
Author:
Carter
Publisher:
McGraw Hill
Glencoe Algebra 1, Student Edition, 9780079039897…
Algebra
ISBN:
9780079039897
Author:
Carter
Publisher:
McGraw Hill