3. The following data represent the age (in weeks) at which babies first crawl based on a survey of 14 mothers. 52, 30, 44, 35, 39, 26, 47, 37, 56, 26, 39, 28, 38, 34 (You can assume that the data come from a normally distributed population and that there are no outliers.) Construct and interpret a 90% confidence interval for the mean age at which a baby first crawls.
3. The following data represent the age (in weeks) at which babies first crawl based on a survey of 14 mothers. 52, 30, 44, 35, 39, 26, 47, 37, 56, 26, 39, 28, 38, 34 (You can assume that the data come from a normally distributed population and that there are no outliers.) Construct and interpret a 90% confidence interval for the mean age at which a baby first crawls.

Glencoe Algebra 1, Student Edition, 9780079039897, 0079039898, 2018
18th Edition
ISBN:9780079039897
Author:Carter
Publisher:Carter
Chapter10: Statistics
Section10.4: Distributions Of Data
Problem 19PFA

Related questions
Question
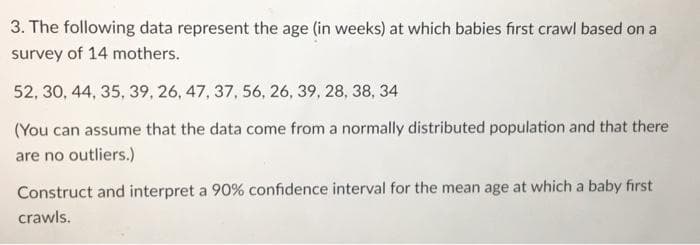
Transcribed Image Text:3. The following data represent the age (in weeks) at which babies first crawl based on a
survey of 14 mothers.
52, 30, 44, 35, 39, 26, 47, 37, 56, 26, 39, 28, 38, 34
(You can assume that the data come from a normally distributed population and that there
are no outliers.)
Construct and interpret a 90% confidence interval for the mean age at which a baby first
crawls.
Expert Solution
This question has been solved!
Explore an expertly crafted, step-by-step solution for a thorough understanding of key concepts.

This is a popular solution!

Trending now
This is a popular solution!

Step by step
Solved in 2 steps with 2 images

Recommended textbooks for you
Glencoe Algebra 1, Student Edition, 9780079039897…
Algebra
ISBN:
9780079039897
Author:
Carter
Publisher:
McGraw Hill
Glencoe Algebra 1, Student Edition, 9780079039897…
Algebra
ISBN:
9780079039897
Author:
Carter
Publisher:
McGraw Hill