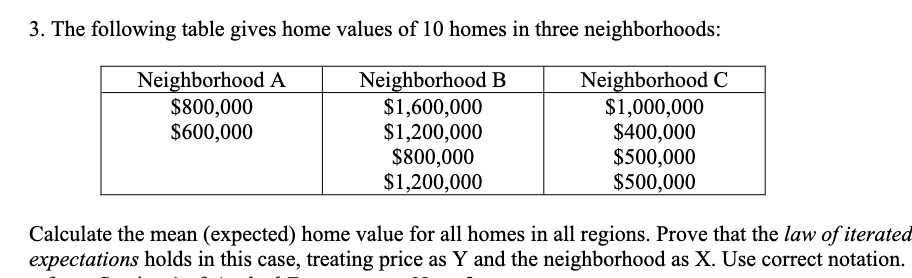
3. The following table gives home values of 10 homes in three neighborhoods: Neighborhood A $800,000 $600,000 Neighborhood B $1,600,000 $1,200,000 $800,000 $1,200,000 Neighborhood C $1,000,000 $400,000 $500,000 $500,000
3. The following table gives home values of 10 homes in three neighborhoods: Neighborhood A $800,000 $600,000 Neighborhood B $1,600,000 $1,200,000 $800,000 $1,200,000 Neighborhood C $1,000,000 $400,000 $500,000 $500,000

Functions and Change: A Modeling Approach to College Algebra (MindTap Course List)
6th Edition
ISBN:9781337111348
Author:Bruce Crauder, Benny Evans, Alan Noell
Publisher:Bruce Crauder, Benny Evans, Alan Noell
Chapter5: A Survey Of Other Common Functions
Section5.3: Modeling Data With Power Functions
Problem 6E: Urban Travel Times Population of cities and driving times are related, as shown in the accompanying...

Related questions
Question
Transcribed Image Text:3. The following table gives home values of 10 homes in three neighborhoods:
Neighborhood A
$800,000
$600,000
Neighborhood B
$1,600,000
$1,200,000
$800,000
$1,200,000
Neighborhood C
$1,000,000
$400,000
$500,000
$500,000
Calculate the mean (expected) home value for all homes in all regions. Prove that the law of iterated
expectations holds in this case, treating price as Y and the neighborhood as X. Use correct notation.
Expert Solution
This question has been solved!
Explore an expertly crafted, step-by-step solution for a thorough understanding of key concepts.

Step by step
Solved in 3 steps

Recommended textbooks for you
Functions and Change: A Modeling Approach to Coll…
Algebra
ISBN:
9781337111348
Author:
Bruce Crauder, Benny Evans, Alan Noell
Publisher:
Cengage Learning
Functions and Change: A Modeling Approach to Coll…
Algebra
ISBN:
9781337111348
Author:
Bruce Crauder, Benny Evans, Alan Noell
Publisher:
Cengage Learning