3. Use binomial table and graph for n= 5, p=0.98 to answer the following: a. What is the shape of the binomial distribution when p= 0.98? %3D b. Use the Excel table and your TI-84 to find the mean and standard deviation of this binomial probability distribution. (Enter the probability column without rounding) Mean = %3D Frandard Deviation
3. Use binomial table and graph for n= 5, p=0.98 to answer the following: a. What is the shape of the binomial distribution when p= 0.98? %3D b. Use the Excel table and your TI-84 to find the mean and standard deviation of this binomial probability distribution. (Enter the probability column without rounding) Mean = %3D Frandard Deviation

Algebra & Trigonometry with Analytic Geometry
13th Edition
ISBN:9781133382119
Author:Swokowski
Publisher:Swokowski
Chapter2: Equations And Inequalities
Section2.5: Other Types Of Equations
Problem 65E

Related questions

Question

Transcribed Image Text:Number
24
fr
D
G
K
"X"
"P(X)"
3.2E-09
RUKIA n=5 and p-0.02
1
0.092237
0.003765
3.
7.68E-05
4
7.84E-07
4
7
3.2E-09
3
10
1
1.
11
12
2
3
4
13
14
"P(X)" "P(X)"
15
16
17
18
19
20
21
22
23
24
25

Transcribed Image Text:Paragraph
Styles
ur stored credentials are out of date. Please sign in as rmohamed26@student.cscc.edu so we can verify your subscription.
Voice
Sign In
u.
VV 1lai uo you nouct auvut youI SOlutiOIS LO parLS U ana C!
3. Use binomial table and graph for n= 5, p= 0.98 to answer the following:
a. What is the shape of the binomial distribution when p 0.98?
b. Use the Excel table and your TI-84 to find the mean and standard deviation of this binomial
probability distribution. (Enter the probability column without rounding)
Mean =
Frandard Deviation =
c. Now use the binomial formulas below to find the mean and standard deviation when n= 5 and
p=0.98.
Mean = µ = n·p
Standard Deviation =o = npq
d. What do you notice about your solutions to parts b and c?
Copyright © 2020 by Dann Marketes and Leslie Smith. All rights reserved. No part of this publication may be reproduced, distributed, or transmitted in
any form or by any means, including photocopying, recording, or other electronic or mechanical methods.
O Focus
Accessibility: Investigate
Expert Solution
Step 1
Hello! As you have posted more than 3 sub parts, we are answering the first 3 sub-parts. In case you require the unanswered parts also, kindly re-post that parts separately.
a.
From the given information, n=5 and p=0.98.
The probability mass function for Binomial distribution is,
Therefore,
| X | |
| 0 | 3.2E-09 |
| 1 | 7.84E-07 |
| 2 | 7.68E-05 |
| 3 | 0.003765 |
| 4 | 0.092237 |
| 5 | 0.903921 |
Graph:
Excel Procedure:
- Enter the X and P(X) values in Excel.
- Select the data in excel.
- Go to insert.
- Go to insert statistic chart.
- click on histogram.
Excel Output:
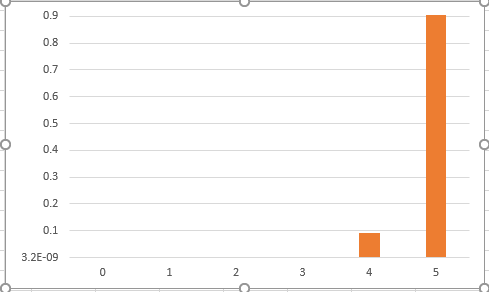
From the above diagram, the data values are distributed on the right side. That is, the tail exists on left side.
Hence, the shape of the binomial distribution is left skewed.

Trending now
This is a popular solution!

Step by step
Solved in 3 steps with 1 images

Knowledge Booster


Learn more about
Need a deep-dive on the concept behind this application? Look no further. Learn more about this topic, statistics and related others by exploring similar questions and additional content below.Recommended textbooks for you
Algebra & Trigonometry with Analytic Geometry
Algebra
ISBN:
9781133382119
Author:
Swokowski
Publisher:
Cengage

Functions and Change: A Modeling Approach to Coll…
Algebra
ISBN:
9781337111348
Author:
Bruce Crauder, Benny Evans, Alan Noell
Publisher:
Cengage Learning

Elementary Linear Algebra (MindTap Course List)
Algebra
ISBN:
9781305658004
Author:
Ron Larson
Publisher:
Cengage Learning
Algebra & Trigonometry with Analytic Geometry
Algebra
ISBN:
9781133382119
Author:
Swokowski
Publisher:
Cengage
Functions and Change: A Modeling Approach to Coll…
Algebra
ISBN:
9781337111348
Author:
Bruce Crauder, Benny Evans, Alan Noell
Publisher:
Cengage Learning
Elementary Linear Algebra (MindTap Course List)
Algebra
ISBN:
9781305658004
Author:
Ron Larson
Publisher:
Cengage Learning

College Algebra
Algebra
ISBN:
9781305115545
Author:
James Stewart, Lothar Redlin, Saleem Watson
Publisher:
Cengage Learning

Algebra and Trigonometry (MindTap Course List)
Algebra
ISBN:
9781305071742
Author:
James Stewart, Lothar Redlin, Saleem Watson
Publisher:
Cengage Learning