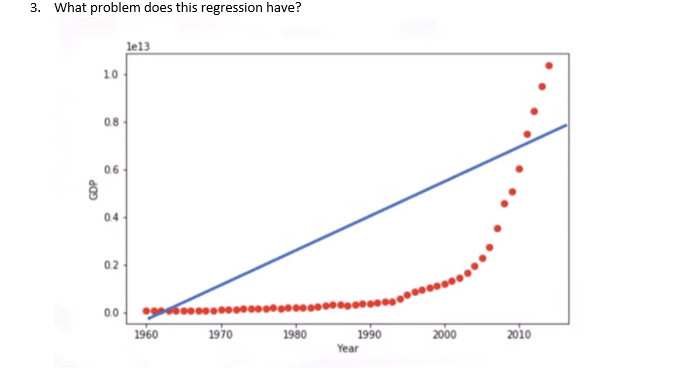
3. What problem does this regression have? le13 10 08 06 04 02 00 GDP


Q: 3. The table below shows the salary, in millions, made by the highest paid major league baseball…
A: Given table,
Q: Below is some of the regression output from a regression of the amount rental houses on an island…
A: the estimated equation is, Price = 1474 + 0.31*Size + 1885*View + 0.10*(Size*View) #for size = 3900,…
Q: How many independent variables are there in simple linear regression analysis? 1 2…
A: The estimated model for a simple linear regression analysis is y=α+βx, where y is the dependent…
Q: A researcher is interested in finding out the factors which determined the yearly spending on family…
A: Solution
Q: 10. The following is the equation for a regression line concerning square footage and rent for…
A:
Q: In simple linear regression: a.The larger the coefficient of determination, then the more precisely…
A:
Q: Table CS2.1 Summary of regressions of the models Model MSE 1 10,704 .966 10,248 .967 9,640 .969 4…
A: Given, Model MSE R^2 S 1 10,704 0.966 103 2 10,248 0.967 101 3 9,640 0.969 98 4 9,620…
Q: 4) Find the regression line equation for the following data (formula or calculator). 3 9. 15 19 25
A: Since you have asked multiple question, we will solve the first question for you. If you want any…
Q: Q.4 Why do we need regression analysis? What do we mean by a linear regression model?
A: Q. 4 a. Regression analysis is meant to determine the best functional relationship between a…
Q: Example Find the regression equation Y on X for the following data. X: 2 4 6. 8 Y: 15 20 25
A:
Q: What is the Difference between linear regression and multiple regression analysis?
A: Note: Hey there! Thank you for the question. As you have posted two questions, as per our policy, we…
Q: The price of a movie ticket in a given year can be modeled by the regression equation y 6.94(1.02*),…
A: The regression equation is y = 6.94(1.02x), where x is the year and y is the ticket price.
Q: (d) If the life expectancy is increased by 4 years in a certain country, how much will the happiness…
A: Provided information is ; regression line is y^ = a + b x where ; y = happiness index…
Q: 8 - 10. What is the regression equation in this case? a. y = -853.81 + 85.89x b. y = -853.81 +…
A: Note: According to Bartleby guidelines, we can answer only first question with their three subparts…
Q: Michael believes the following model is correct: Wage = B0 + B1 *Schooling + B2* Experience +…
A: Regression is used to predict the value of dependent variable by using one or more independent…
Q: 5. We estimate the following regression model to predict wage of employees in a firm. Exp is years…
A: The regression coefficients β1, β2, β3 measures the changes in wage when the variables experience,…
Q: 3. Jackson relies on his customers to tell their friends about his business. His business grows as…
A: Consider the given table, X 3 4 7 10 12 13 17 18 21 27 30 Y 12 14 18 23 28 31 46 50 67 118 157…
Q: A linear regression equation has b = 2 and a = 3. What is the predicted value of Y for X = 8? a. Y =…
A: It is given that a =3 and b =2.
Q: You observe data on 500 fruit pickers. Each picker works eight hours in the field. The variable kg…
A: The regression line are used to predict the future variable. Each regression line has two variables,…
Q: The table below shows a furniture store's expected profit in dollars for selling x tables. 4 10 f…
A: In the question it is asked to make a quadratic equation of the data given. Also it is asked to…
Q: like to study the relationship between the number of family members in a household z and number of…
A:
Q: 16. Suppose that regression of income and years of experience yields the regression equation:…
A: Given, The regression equation is: Income = 10000 + 2000*Experience To find, the given statements…
Q: You observe data on 500 fruit pickers. Each picker works eight hours in the field. The variable kg…
A:
Q: You observe data on 500 fruit pickers. Each picker works eight hours in the field. The variable kg…
A:
Q: caribou in 1000's (x) 30 34 27 25 17 23 20 wolves (y) 66 79 70 60 48 55 60 5. What is the slope…
A:
Q: You are giving the regression equation of how the sales trend varies with time: y= 300 + 25x Where:…
A: Regression analysis is used to predict the value of dependent variable by using one or more…
Q: Answer the following... What is linear regression used for? How do researchers set up and use the…
A: Linear regression is used to examine the relationship between the dependent and independent…
Q: 29. An instructor measured quiz scores and the number of hours studying among a sample 20 college…
A: We want to find regression equation
Q: B/Complete: 1- The goal of regression equation is .
A: The Linear Regression Equation has the form Y= a + bX where Y is the dependent variable X is the…
Q: If a linear regression equation had the following form Y = 3 - 2 X: choose the correct statement:…
A:
Q: We estimate the following regression model to predict wage of employees in a firm. Exp is years of…
A: From the given information, Consider, the regression model can be expressed as:…
Q: a. What is the regression equation? Please write it out, including the residual term. b. What is the…
A: Assuming, Let y = Dependent variable = years of schooling completed by Respondent, Let x =…
Q: 0.6. Calculate regression equation from the following and take deviation from x =7 and y = 5: x = 4…
A:
Q: A linear regression has a =6 and b=5 what is y predicted as when x=9? B) A linear regression has…
A:
Q: In a simple regression problem, r and B may have opposite signs. O must have the same sign. O must…
A: We know that, in a simple regression problem, r = correlation coefficient B = slope
Q: 6. 4 6. 1 4 Find the regression equation for predicting Y from x. 3. 4, 2.
A: Given data, X Y X*Y X*X 3 8 24 9 5 8 40 25 2 6 12 4 2 3 6 4 4 6 24 16 1 4 4 1 4 7…
Q: The lecturer is interested to see what variables, if any will help determine the number of hours…
A: Note: Hey, since there are multiple subparts posted, we will answer first three subparts. If you…
Q: 7. The following table lists the amount of ice cream consumed in the United States (in millions of…
A: hence, our inputs are :- Sum of X = 8078 Sum of Y = 1069Mean of X (MX) =…
Q: 6. 6 y -8 7 If a linear regression were fit to the data, how many residuals would there be? 6. 4…
A: We have given that the data of two random variables X and Y.
Q: What can you tell me about the following linear regression equation? Y’ = 3.25x + 19.3
A: From the above data. We have given that the regression line y on x Y’ = 3.25x + 19.3 Here the…
Q: Given the following multiple linear regression: y = Bo + Bizı + Baza+. + Ba +u You decide to try to…
A: Multiple linear regression model: A multiple linear regression model is given as y = b0 + b1x1 +…
Q: a. What is the value of a? b. What is the value of b? c. What is the regression equation?
A: Since you have posted multiple subparts , we will solve first three subparts for you. To get the…
Q: a) What is dependent and independent variables? b) Fully write out the regression equation c) Fill…
A: a) Dependent variable: The variable that is changed because of the influence of the independent…
Q: If the equation for the regression line is y' = 8x + 7, then a value of x = -2 will result in a…
A: Linear regression: Suppose (x1, y1), (x2, y2)---(xn, yn) are n pairs of observations on variables X…
Q: 1. 3. Using a calculator, determine the equation of linear regression. 2. 4. If a person is 82in in…
A: We want to find the equation of linear regression
Q: Can you discuss the potential pitfalls of this scenario? The regression equation based on data from…
A: Given Regression equationy=6+32x X represent year To forecast the result in year 20 we plug in x=20…
Q: 2 2 (b) Find the equation of the regression line. (Round the values to two decimal places.) in
A: Using excel, data has been plotted
Q: 2. The sales, in millions of pesos, of a certain company are shown in the table below. Year X Sales…
A: From the provided information, Year X Sales Y 1 12 2 15 3 17 4 18…
Q: You observe data on 500 fruit pickers. Each picker works eight hours in the field. The variable kg…
A:
Q: 2. Following are data on the worldwide shipments of personal computers (in thousands) according to…
A: solution: (a) The linear model is: y = -5391.9341 + 6115.591x The fitted values are residuals are:…

Step by step
Solved in 2 steps with 1 images

- Olympic Pole Vault The graph in Figure 7 indicates that in recent years the winning Olympic men’s pole vault height has fallen below the value predicted by the regression line in Example 2. This might have occurred because when the pole vault was a new event there was much room for improvement in vaulters’ performances, whereas now even the best training can produce only incremental advances. Let’s see whether concentrating on more recent results gives a better predictor of future records. (a) Use the data in Table 2 (page 176) to complete the table of winning pole vault heights shown in the margin. (Note that we are using x=0 to correspond to the year 1972, where this restricted data set begins.) (b) Find the regression line for the data in part ‚(a). (c) Plot the data and the regression line on the same axes. Does the regression line seem to provide a good model for the data? (d) What does the regression line predict as the winning pole vault height for the 2012 Olympics? Compare this predicted value to the actual 2012 winning height of 5.97 m, as described on page 177. Has this new regression line provided a better prediction than the line in Example 2?The following fictitious table shows kryptonite price, in dollar per gram, t years after 2006. t= Years since 2006 0 1 2 3 4 5 6 7 8 9 10 K= Price 56 51 50 55 58 52 45 43 44 48 51 Make a quartic model of these data. Round the regression parameters to two decimal places.Table 6 shows the population, in thousands, of harbor seals in the Wadden Sea over the years 1997 to 2012. a. Let x represent time in years starting with x=0 for the year 1997. Let y represent the number of seals in thousands. Use logistic regression to fit a model to these data. b. Use the model to predict the seal population for the year 2020. c. To the nearest whole number, what is the limiting value of this model?
- For the following exercises, consider this scenario: The profit of a company decreased steadily overa ten-year spam.The following ordered pairs shows dollars and the number of units sold in hundreds and the profit in thousands ofover the ten-year span, (number of units sold, profit) for specific recorded years: (46,600),(48,550),(50,505),(52,540),(54,495). Use linear regression to determine a function Pwhere the profit in thousands of dollars depends onthe number of units sold in hundreds.Cable TV The following table shows the number C. in millions, of basic subscribers to cable TV in the indicated year These data are from the Statistical Abstract of the United States. Year 1975 1980 1985 1990 1995 2000 C 9.8 17.5 35.4 50.5 60.6 60.6 a. Use regression to find a logistic model for these data. b. By what annual percentage would you expect the number of cable subscribers to grow in the absence of limiting factors? c. The estimated number of subscribers in 2005 was 65.3million. What light does this shed on the model you found in part a?What does the y -intercept on the graph of a logistic equation correspond to for a population modeled by that equation?
- Table 2 shows a recent graduate’s credit card balance each month after graduation. a. Use exponential regression to fit a model to these data. b. If spending continues at this rate, what will the graduate’s credit card debt be one year after graduating?For the following exercises, use Table 4 which shows the percent of unemployed persons 25 years or older who are college graduates in a particular city, by year. Determine whether the trend appears linear. If so, and assuming the trend continues, find a linear regression model to predict the percent of unemployed in a given year to three decimal places.a. find the equation of the regression line? b. the best-predicted crash fatality rate for a year in which there are 500 metric tons of lemon imports is _?_ facilitates per 100,000 population,
- The follow table gives the approximate economic value associated with various levels of oil recovery in Texas. Find the regression line, and use it to estimate the economic value associated with a recovery level of 70%.The following linear regression model predicts a person's height (cm) from the length of their shoe print (cm) Height^=3.5×Shoe Print+80 What is the predicted height of a person with a 30 cm shoe print? Assume extrapolation is not an issue. 185 cm 80 cm 202.5 cm 167.5 cmwrie down the estimated regression equation?


