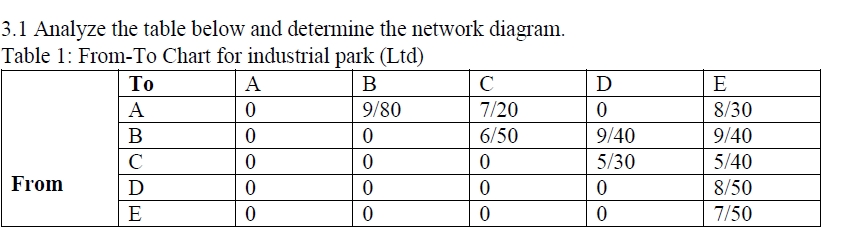
3.1 Analyze the table below and determine the network diagram. Table 1: From-To Chart for industrial park (Ltd) B 9/80 From To A B BUTOE C D A 0 0 0 0 0 0 0 0 0 C 7/20 6/50 0 0 0 D 0 9/40 5/30 0 0 E 8/30 9/40 5/40 8/50 7/50


Q: PT ABC logistics have operating in city ABC for 3 months, where they have 10,000 orders daily on…
A: Logistics management is one of the critical functions of management which mainly revolves around the…
Q: Location Problem with Two Sites. Oliveira Office Supply has a large retail system consisting of…
A: Oliveira Office Supply has 12 retail stores spread around the country.The coordinates of the store…
Q: Please no written by hand solutions QUESTION 5 With the number of risk factors growing…
A: Procurement directs the process of obtaining goods, services, or works from outer sources to fulfill…
Q: Why are phone calls a more effective technique of data collection when compared to other approaches
A: Data collection is the process of compiling precise data from numerous sources and analysing it to…
Q: Considers the tasks, durations, and predecessor relationships in the following network. Draw the CPM…
A: Expected Time duration (te) = (a+4m+b)/6Variance = {(b-a) / 6}2Where,(a) = Optimistic time(m) = Most…
Q: The implementation of Business Intelligence is not without its difficulties, so what are they?
A: The typical workloads of multinational corporations in a variety of sectors are changing as a result…
Q: Alison's Accessories is a high volume worldwide fashion house with outlets in 65 countries. Sadly,…
A: Transportation management is the process of management of all those activities which is important…
Q: Question 2: sart ever Activity A Activity B Activity A Activity B Activity C Activity D Activity E…
A: Cycle time efficiency is the effectiveness of a system in utilizing the time that is available to…
Q: 9. Calculate the process design capacity, available capacity, actual capacity, capacity utilization,…
A: The process design capacity represents the ability of an organization to ensure its processes are…
Q: The weekly demand amount for a product is 2200 pieces and 12% of the incoming products are…
A: EOQ stands for Economic Order Quantity. It is a formula used in inventory management to determine…
Q: When we say that the requirements should be complete and uniform, what do we mean exactly?
A: In the domain of project management, it is essential for the successful completion of any endeavour…
Q: Briefly discuss , What are the key considerations when designing a facility layout for lean…
A: Facility layout refers to the arrangement of different components, such as workstations, equipment,…
Q: Genjeteye, Inc. makes aircraft engines. The mean time to failure has been found to be 100,000 hours…
A: Failure rate refers to the frequency or likelihood of failure of a system, product, process, or…
Q: Please do not give solution in image formate thanku. Catherine Creteau and her husband contracted…
A: Catherine Creteau and her husband entered into an agreement with Liberty Travel, a travel agency, to…
Q: How might a brick-and-mortar retailer that makes use of FBA link its data tools with Amazon's?
A: Brick-and-mortar retailers that leverage Fulfillment by Amazon (FBA) have the opportunity to…
Q: For this assignment you must pick 6 project management tools or techniques – one from each of the…
A: Project management is the discipline of planning, organizing, and overseeing the successful…
Q: Suppose that a product with an annual demand of 2400 units, a setup cost per production run of $8,…
A: Inventory models help us to find the least cost order quantity.In EOQ model. The quantity ordered is…
Q: Is it feasible to include data warehouse design into operational system configurations?
A: Warehouse design is the process that is adopted by the manager of the company to create an efficient…
Q: Consider the following decision tree. The objective is to choose the best decision among the two…
A: Here, In the question, I have been given the decision tree, The alternatives are A and B. I would…
Q: The project contains 6 tasks. We completed three tasks (A, B, C), and started two (D, E) but could…
A: There are 6 tasks given in the table, with their respective Planned budget, the actual cost incurred…
Q: What are the commonly referenced advantages of IT outsourcing?
A: Every organization need to handle some IT related activities for which special team is required with…
Q: A hospital expects 5,000 admissions for the year, but that number could vary by 1,000 more or less.…
A: Operating leverage is a measure of how sensitive a company's operating income is to its fixed costs.…
Q: Critically discuss the financial implications of Eskom hiring suppliers with limited capacity and…
A: Suppliers are individuals, companies, or organizations that provide goods, services, or raw…
Q: Your final estimate of lost sales for the Carlson Department store for Sept – Dec 2013.
A: Sales for the Carlson Department store for Sept-Dec for 2009-2012…
Q: A blueprint of a gallery with eight rooms, one entrance and thirteen doorways is shown. The gallery…
A: Integer programming is a mathematical optimization technique that deals with the optimization of a…
Q: You are required to assess key functions including risk management and compliance for the Bank of…
A: Risk management refers to the systematic process of identifying, assessing, prioritizing, and…
Q: Who has ultimate authority over when and how corporate data is used?
A: Corporate data is of immense significance in today's data-driven era. The usage and handling of this…
Q: How is the total cost of ownership different from the network cost of ownership, often known as the…
A: Management refers to the process of planning, organizing, coordinating, and controlling resources…
Q: Give typing answer with explanation and conclusion What are CrossFit’s core competencies that give…
A: The sustainable competitive advantage refers to the set of qualities as well as resources of a…
Q: It's important to distinguish between storage done on the premises and offsite storage.
A: When it comes to data storage, it is crucial to understand the distinction between on-premises…
Q: Why does it cost so much money and carry so much risk to replace outdated systems with new ones
A: If we replace the outdated systems with new ones, This initiative would be expensive and we could…
Q: Why is earned value management (EVM) underutilised? Explain how it may be used to track spending and…
A: Earned Value Management (EVM) is a powerful technique used in project management to track project…
Q: A highway contractor needs to locate a single supply point to provide road building materials to…
A: The Center of Gravity Method is a location analysis technique used to determine the ideal…
Q: Identify potential issues that may arise from the implementation of new management science tools and…
A: Starbucks is a well-known company; over time, they have adopted technologies and maintained…
Q: The project team gathers data on the reasons why a specific project task is causing problems and the…
A: When faced with problems in a specific project task, it is crucial for a project team to gather data…
Q: Scenario -- Deep Blue Seaways Deep Blue Seaways (a UK based company) is a shipping company that…
A: The current management style at Deep Blue Seaways is fragmented and lacking in cooperation between…
Q: Option 2: Raise prices by 50%. If this occurs, there is a 75% chance that an Entrepreneur will set…
A: A decision tree is a flowchart-like structure used in machine learning and decision analysis to…
Q: LuSE (Lusaka Securities Exchange) has been voted as one of the top 10 best performing securities…
A: The performance of securities markets in Africa can be evaluated based on various factors, such as…
Q: Why is ISO relevant to systems developers?
A: The International Organization for Standardization (ISO) is an independent, non-governmental…
Q: Is it feasible to increase production while requiring less maintenance?
A: Continuous improvement is a philosophy and approach aimed at constantly enhancing processes,…
Q: Get a grip on the nuts and bolts of ERP systems and purchasing databases, my friend?
A: ERP Systems:Enterprise Resource Planning (ERP) systems are the software solutions that integrate…
Q: BlueMoon Bottlers has a bottle-filling process with a mean value of 64 ounces and a standard…
A: It is the measurement of a process capability. It primarily express how nearly a process is capable…
Q: Given the global nature of Skype’s operations, which changes in the macro-context have posed the…
A: The business environment helps a company in identifying those areas which can provide benefit to the…
Q: Operations management consulting services?
A: Operations management consulting services are the professional advisory services provided to…
Q: We’re Computers sells PCs to colleges on the East Cost and ships them from three distribution…
A: The transportation problem is a classic optimization problem in operations research and mathematical…
Q: Do you think that the growth of automation is to blame for the increase in knowledge workers?
A: The growth of the automation, driven by advancements in the technology, has had the significant…
Q: end out an RFP for suggestions on how to improve the KFC mobile app ordering process.
A: The RFP aims to invite interested parties to propose innovative ideas and solutions to improve the…
Q: Describe the picture of the supply chain process above in detail, complete and correct
A: Supply chain optimisation can be defined as the process of adjusting a supply chain's activities to…
Q: Briefly discuss the role of computers in the Global Supply Chai
A: Computers are essential to the global supply chain because they make it easier to do business,…
Q: Please provide at least two approaches you've used to reduce the expense of reworking. How does…
A: Here, these two approaches are Process improvement and quality assurance, Iterative development, and…

Step by step
Solved in 3 steps with 1 images

- (a) Construct the network diagram?1. Overall, what is the overlap between Network Solutions system and an ideal system? 2. What are the features of the system implemented at Network Solutions that correspond to the features described in the chapter as ideal characteristics?As the Operations Manager of Shane Manufacturing Ltd., you are given the task to balance the assembly line that is used to produce a special type of toy. b. Draw the precedence diagram for the problem that you set up in part “a” above. c. Use the example that you set up to demonstrate how you will balance the line. d. Calculate the efficiency of the line.
- how would It look in a network diagram?able 4-4 on page 197 shows a relation called GRADE REPORT for a university. Your assignment is as follows: Draw a relational schema and diagram the functional dependencies in the relation. In what normal form is this relation? Decompose GRADE REPORT into a set of 3NF relations. Draw a relational schema for your 3NF relations and show the referential integrity constraints (as shown in Figure 4-5 on page 163). Draw an ER-diagram for your answer to part d above.Given in the following table are the tasks necessary for final assembly of a hospital bed, the length of time needed to perform each task, and the operations that must be completed prior to subsequent operations. Construct a precedence diagram and balance the assembly line for a desired cycle time of 14 minutes. Draw a schematic diagram of the balanced line. How many beds can actually be assembled in an eight-hour period? Element Precedence Time (min) A None 4 B None 5 C None 8 D A 4 E A, B 3 F B 3 G D, E 5 H F 7 I G, H 1 J I 7 K C, J 4
- Gantt Chart and Network Methods. Compare them with a working example not from the text. Neatly draw a Gantt Chart and discuss how it works with your example.You have just been hired as the director of operationsfor Reid Chocolates, a purveyor of exceptiona lly finecandies. Reid Chocolates has two kitchen layouts under considerationfor its recipe making and testing department. The stra tegyis to provide the best kitchen layout possible so that foodscientists can devote their time and energy to product improvement,not wasted effort in the kitchen. You have been asked toevaluate these two kitchen layouts and to prepare a recommendationfor your boss, Mr. Reid, so that he can proceed to placethe contract for building the kitchens. [See Figure 9.20(a), andF igure 9.20(b).)What is a precedence diagramand what are its various components? Briefly explain.
- Scenario1: 'Backbone' Hospital Management System Expert Infotech Ltd. has developed — 'Backbone' Hospital Management System (HMS) that works for all major functional areas of Hospital. Its modules include Registration, Billing, Consultation, Laboratory, Blood bank, Radiology, Inpatient, Stores and Purchase and Critical care areas. Dr. Mike, Operations Manager, “SafeHands Hospitals”, was impressed by the applications of 'Backbone' HMS and wanted to get details on various transactions and process controls that facilitates the hospital operations. Scenario2: 'Backbone' Hospital Management System In continuation with the previous scenario, Dr. Mike got convinced with your explanation and interested towards purchasing 'Backbone' Hospital Management System (HMS). He also wanted an Executive Module added to other application modules. He further added that having an Executive Module would help the executives/ top heads of the hospital about various performance indicators and aids in…Cellular layout works effectively with Select one: O a. assembly lines O b. All of the choices O c wireless telecommunication O d. warehouse design O e part familiesComplaints have come to the department manager regarding timeliness of requests for patient information and a decision must be made. Three months ago, Community Hospital opened a 24-hour urgent-care center 10 miles away in a rapidly growing community. Kent Jones, the health information services manager, took part in the planning that included the use of a combined record and one patient identification number. The decision was made to allow electronic sharing of patient records between the facilities; however, at present it is necessary to fax some portions of the record upon request. In the past month, Kent has received four complaints from the urgent care center that records were not faxed in a timely manner. There are 26 employees in health information services. Three full-time employees care for record activity during the day, with one employee devoted to record activity during the evening shift, when a team leader and four other employees are usually in the department. During the…