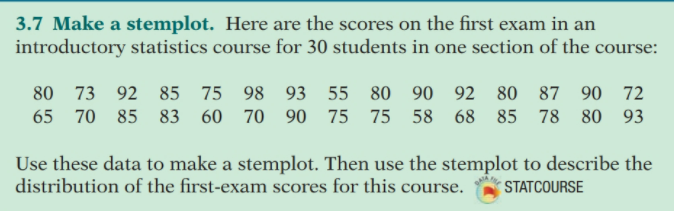
3.7 Make a stemplot. Here are the scores on the first exam in an introductory statistics course for 30 students in one section of the course: 80 73 92 85 75 98 93 55 80 90 92 80 87 90 72 65 70 85 83 60 70 90 75 75 58 68 85 78 80 93 Use these data to make a stemplot. Then use the stemplot to describe the distribution of the first-exam scores for this course. STATCOURSE
3.7 Make a stemplot. Here are the scores on the first exam in an introductory statistics course for 30 students in one section of the course: 80 73 92 85 75 98 93 55 80 90 92 80 87 90 72 65 70 85 83 60 70 90 75 75 58 68 85 78 80 93 Use these data to make a stemplot. Then use the stemplot to describe the distribution of the first-exam scores for this course. STATCOURSE

Glencoe Algebra 1, Student Edition, 9780079039897, 0079039898, 2018
18th Edition
ISBN:9780079039897
Author:Carter
Publisher:Carter
Chapter10: Statistics
Section10.6: Summarizing Categorical Data
Problem 4AGP

Related questions
Question
Transcribed Image Text:3.7 Make a stemplot. Here are the scores on the first exam in an
introductory statistics course for 30 students in one section of the course:
80 73
92 85 75 98 93 55 80 90 92 80 87 90 72
65 70
85 83 60 70 90 75 75 58 68 85 78 80 93
Use these data to make a stemplot. Then use the stemplot to describe the
distribution of the first-exam scores for this course.
STATCOURSE
Expert Solution
Step 1
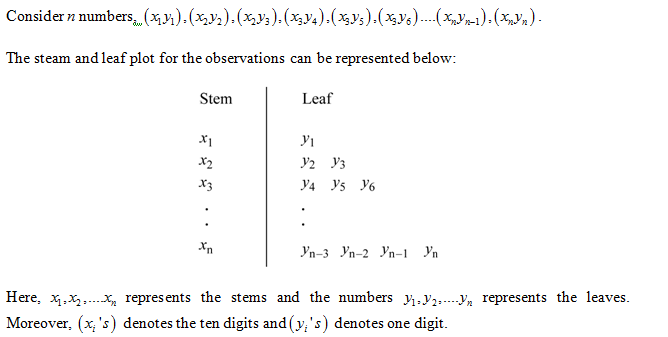
Stem and leaf plot.
The stems are listed in the left side of the vertical line and these numbers symbolize 10’s digits. The leaves are listed to the right of the each stem and they symbolize 1’s digits.

Trending now
This is a popular solution!

Step by step
Solved in 2 steps with 2 images

Recommended textbooks for you
Glencoe Algebra 1, Student Edition, 9780079039897…
Algebra
ISBN:
9780079039897
Author:
Carter
Publisher:
McGraw Hill
Glencoe Algebra 1, Student Edition, 9780079039897…
Algebra
ISBN:
9780079039897
Author:
Carter
Publisher:
McGraw Hill