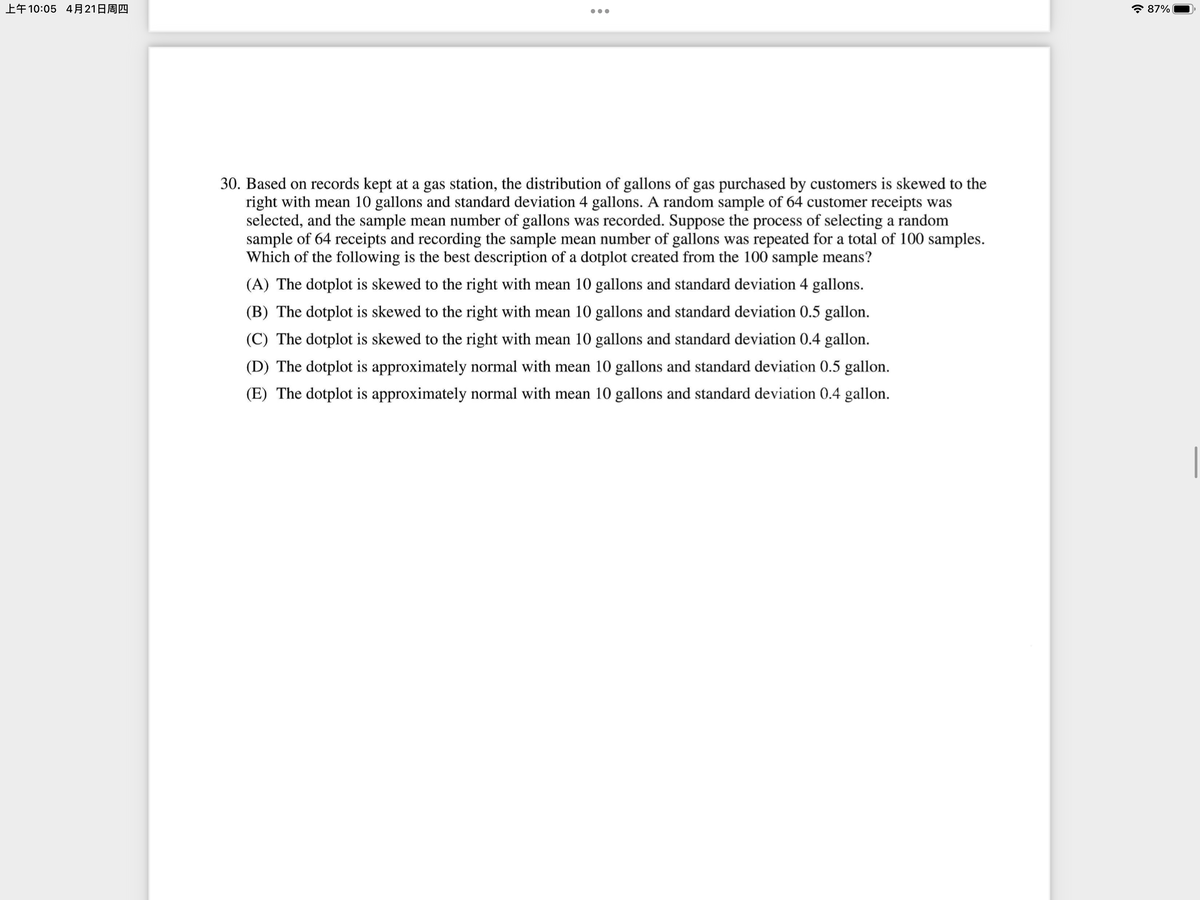
30. Based on records kept at a gas station, the distribution of gallons of gas purchased by customers is skewed to the right with mean 10 gallons and standard deviation 4 gallons. A random sample of 64 customer receipts was selected, and the sample mean number of gallons was recorded. Suppose the process of selecting a random sample of 64 receipts and recording the sample mean number of gallons was repeated for a total of 100 samples. Which of the following is the best description of a dotplot created from the 100 sample means? (A) The dotplot is skewed to the right with mean 10 gallons and standard deviation 4 gallons. (B) The dotplot is skewed to the right with mean 10 gallons and standard deviation 0.5 gallon. (C) The dotplot is skewed to the right with mean 10 gallons and standard deviation 0.4 gallon. (D) The dotplot is approximately normal with mean 10 gallons and standard deviation 0.5 gallon. (E) The dotplot is approximately normal with mean 10 gallons and standard deviation 0.4 gallon.
30. Based on records kept at a gas station, the distribution of gallons of gas purchased by customers is skewed to the right with mean 10 gallons and standard deviation 4 gallons. A random sample of 64 customer receipts was selected, and the sample mean number of gallons was recorded. Suppose the process of selecting a random sample of 64 receipts and recording the sample mean number of gallons was repeated for a total of 100 samples. Which of the following is the best description of a dotplot created from the 100 sample means? (A) The dotplot is skewed to the right with mean 10 gallons and standard deviation 4 gallons. (B) The dotplot is skewed to the right with mean 10 gallons and standard deviation 0.5 gallon. (C) The dotplot is skewed to the right with mean 10 gallons and standard deviation 0.4 gallon. (D) The dotplot is approximately normal with mean 10 gallons and standard deviation 0.5 gallon. (E) The dotplot is approximately normal with mean 10 gallons and standard deviation 0.4 gallon.

Glencoe Algebra 1, Student Edition, 9780079039897, 0079039898, 2018
18th Edition
ISBN:9780079039897
Author:Carter
Publisher:Carter
Chapter10: Statistics
Section10.4: Distributions Of Data
Problem 19PFA

Related questions
Question
Transcribed Image Text:上午10:05 4月21日周四
7 87%
•..
30. Based on records kept at a gas station, the distribution of gallons of gas purchased by customers is skewed to the
right with mean 10 gallons and standard deviation 4 gallons. A random sample of 64 customer receipts was
selected, and the sample mean number of gallons was recorded. Suppose the process of selecting a random
sample of 64 receipts and recording the sample mean number of gallons was repeated for a total of 100 samples.
Which of the following is the best description of a dotplot created from the 100 sample means?
(A) The dotplot is skewed to the right with mean 10 gallons and standard deviation 4 gallons.
(B) The dotplot is skewed to the right with mean 10 gallons and standard deviation 0.5 gallon.
(C) The dotplot is skewed to the right with mean 10 gallons and standard deviation 0.4 gallon.
(D) The dotplot is approximately normal with mean 10 gallons and standard deviation 0.5 gallon.
(E) The dotplot is approximately normal with mean 10 gallons and standard deviation 0.4 gallon.
Expert Solution
This question has been solved!
Explore an expertly crafted, step-by-step solution for a thorough understanding of key concepts.

This is a popular solution!

Trending now
This is a popular solution!

Step by step
Solved in 2 steps

Recommended textbooks for you
Glencoe Algebra 1, Student Edition, 9780079039897…
Algebra
ISBN:
9780079039897
Author:
Carter
Publisher:
McGraw Hill
Glencoe Algebra 1, Student Edition, 9780079039897…
Algebra
ISBN:
9780079039897
Author:
Carter
Publisher:
McGraw Hill