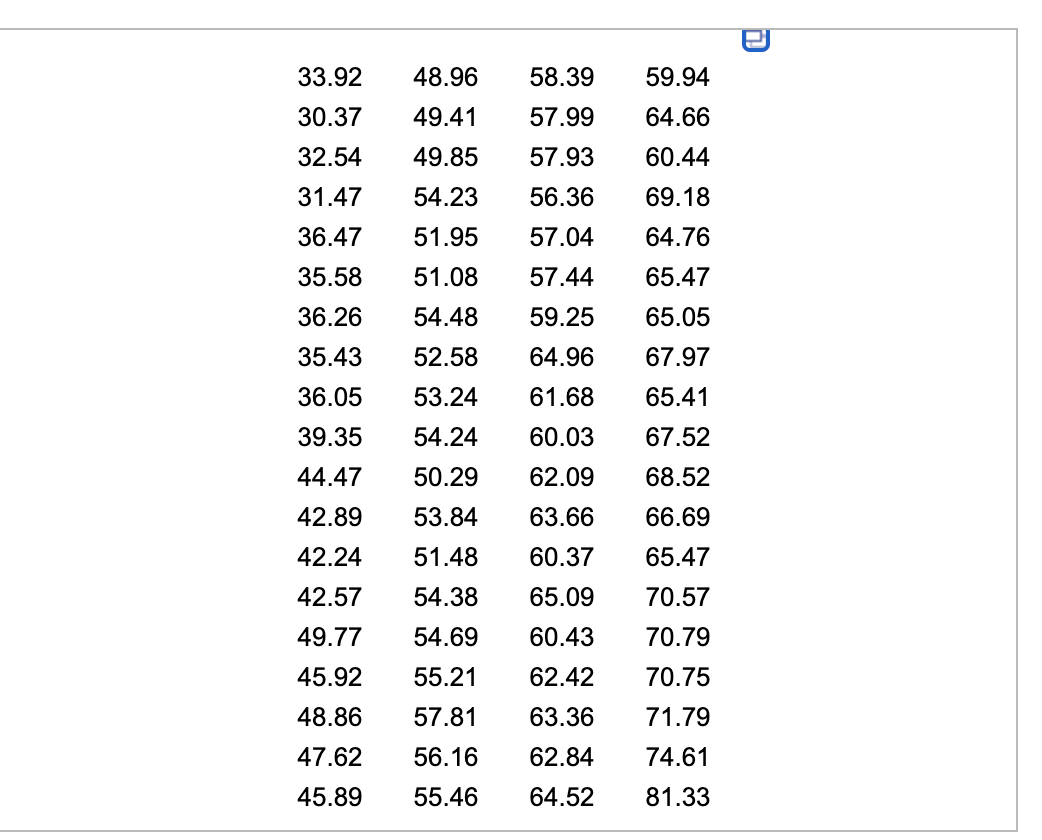
33.92 48.96 58.39 59.94 30.37 49.41 57.99 64.66 32.54 49.85 57.93 60.44 31.47 54.23 56.36 69.18 36.47 51.95 57.04 64.76 35.58 51.08 57.44 65.47 36.26 54.48 59.25 65.05 35.43 52.58 64.96 67.97 36.05 53.24 61.68 65.41 39.35 54.24 60.03 67.52 44.47 50.29 62.09 68.52 42.89 53.84 63.66 66.69 42.24 51.48 60.37 65.47 42.57 54.38 65.09 70.57 49.77 54.69 60.43 70.79 45.92 55.21 62.42 70.75 48.86 57.81 63.36 71.79 47.62 56 16 62 84 74 61


Inverse Normal Distribution
The method used for finding the corresponding z-critical value in a normal distribution using the known probability is said to be an inverse normal distribution. The inverse normal distribution is a continuous probability distribution with a family of two parameters.
Mean, Median, Mode
It is a descriptive summary of a data set. It can be defined by using some of the measures. The central tendencies do not provide information regarding individual data from the dataset. However, they give a summary of the data set. The central tendency or measure of central tendency is a central or typical value for a probability distribution.
Z-Scores
A z-score is a unit of measurement used in statistics to describe the position of a raw score in terms of its distance from the mean, measured with reference to standard deviation from the mean. Z-scores are useful in statistics because they allow comparison between two scores that belong to different normal distributions.

Step by step
Solved in 2 steps with 2 images


