34 and 35 solve both pl,

Glencoe Algebra 1, Student Edition, 9780079039897, 0079039898, 2018
18th Edition
ISBN:9780079039897
Author:Carter
Publisher:Carter
Chapter10: Statistics
Section10.3: Measures Of Spread
Problem 26PFA

Related questions
Question
34 and 35 solve both pl,
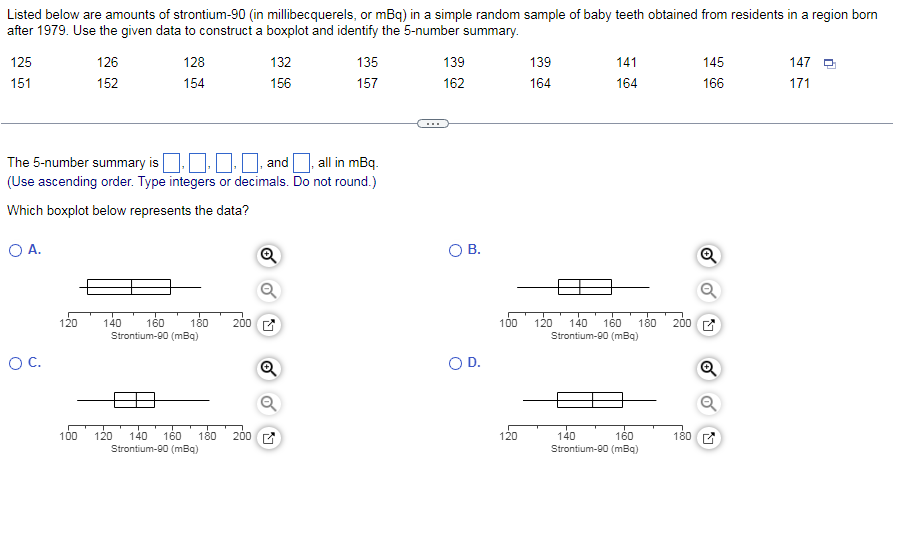
Transcribed Image Text:Listed below are amounts of strontium-90 (in millibecquerels, or mBq) in a simple random sample of baby teeth obtained from residents in a region born
after 1979. Use the given data to construct a boxplot and identify the 5-number summary.
125
126
128
132
135
139
139
141
145
147 O
151
152
154
156
157
162
164
164
166
171
The 5-number summary is O.0 O and all in mBq.
(Use ascending order. Type integers or decimals. Do not round.)
Which boxplot below represents the data?
OA.
O B.
Q
180
200 C
200
120
140
160
100
120
140
160
Strontium-00 (mBq)
180
Strontium-90 (mBq)
OC.
OD.
100
120 140
180
140
Strontium-90 (mBq)
160
200 E
120
160
180
Strontium-90 (mBq)
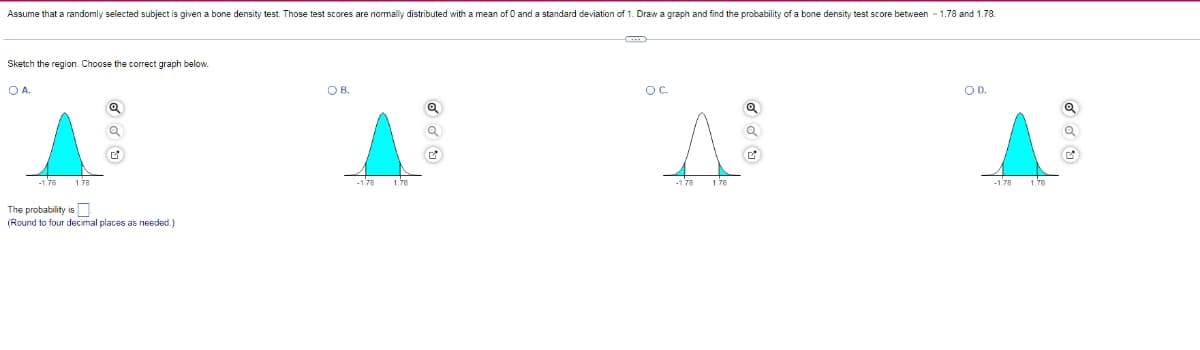
Transcribed Image Text:Assume that a randomly selected subject is given a bone density test. Those test scores are normally distributed with a mean of O and a standard deviation of 1. Draw a graph and find the probability of a bone density test score between - 1.78 and 1.78.
Sketch the region. Choose the correct graph below.
OA.
OB.
OC.
OD.
1.78
-178
1.78
-178
1.78
The probability is N.
(Round to four decimal places as needed.)
Expert Solution
This question has been solved!
Explore an expertly crafted, step-by-step solution for a thorough understanding of key concepts.

This is a popular solution!

Trending now
This is a popular solution!

Step by step
Solved in 3 steps with 3 images

Recommended textbooks for you
Glencoe Algebra 1, Student Edition, 9780079039897…
Algebra
ISBN:
9780079039897
Author:
Carter
Publisher:
McGraw Hill
Glencoe Algebra 1, Student Edition, 9780079039897…
Algebra
ISBN:
9780079039897
Author:
Carter
Publisher:
McGraw Hill