34) Fig. 34 shows a graph indicating the maxwellian distribution of speeds of gas molecules at two different temperatures T1 and T2 N T2 Figure 34 Which of the following statements is /are correct 1. T,> T2. 2. the rms speed is the velocity at the peak of the curve 3. the area under both curves is the same
34) Fig. 34 shows a graph indicating the maxwellian distribution of speeds of gas molecules at two different temperatures T1 and T2 N T2 Figure 34 Which of the following statements is /are correct 1. T,> T2. 2. the rms speed is the velocity at the peak of the curve 3. the area under both curves is the same

Glencoe Physics: Principles and Problems, Student Edition
1st Edition
ISBN:9780078807213
Author:Paul W. Zitzewitz
Publisher:Paul W. Zitzewitz
Chapter3: Accelerated Motion
Section: Chapter Questions
Problem 104A

Related questions

Concept explainers
Question
Show all working explaining detailly each step.
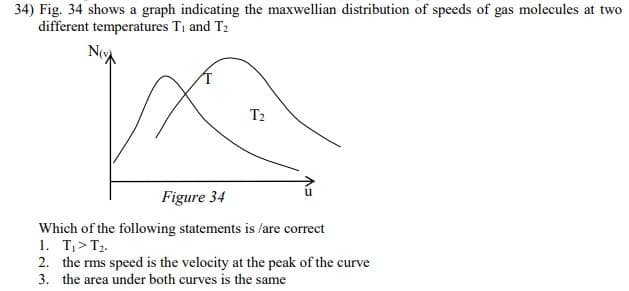
Transcribed Image Text:34) Fig. 34 shows a graph indicating the maxwellian distribution of speeds of gas molecules at two
different temperatures T1 and T2
T2
Figure 34
Which of the following statements is /are correct
1. T,> T2.
2. the rms speed is the velocity at the peak of the curve
3. the area under both curves is the same
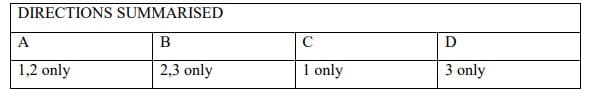
Transcribed Image Text:DIRECTIONS SUMMARISED
A
B
C
D
1,2 only
2,3 only
1 only
3 only
Expert Solution
This question has been solved!
Explore an expertly crafted, step-by-step solution for a thorough understanding of key concepts.

Step by step
Solved in 2 steps with 2 images

Knowledge Booster


Learn more about
Need a deep-dive on the concept behind this application? Look no further. Learn more about this topic, physics and related others by exploring similar questions and additional content below.Recommended textbooks for you
Glencoe Physics: Principles and Problems, Student…
Physics
ISBN:
9780078807213
Author:
Paul W. Zitzewitz
Publisher:
Glencoe/McGraw-Hill
Glencoe Physics: Principles and Problems, Student…
Physics
ISBN:
9780078807213
Author:
Paul W. Zitzewitz
Publisher:
Glencoe/McGraw-Hill