37. Here is a histogram of waiting times of the 1, 159 calls to a customer service center last month. The mean wait was 47.7 minutes with a standard deviation of 33.14 minutes. Describe the center, and spread in context of the sampling distribution of means of random samples of 75 calls taken from this population. Relatve Frequency 035 03 025 02 015 01 005 100 120 minutes A. mean: 47.7 minutes; standard deviation: 33.14 minutes B. mean: 74 df; standard deviation: 3.83 minutes C. mean: 47.7 minutes; standard deviation: 3.83 minutes D. mean: 74 df; standard deviation: 33.14 minutes
37. Here is a histogram of waiting times of the 1, 159 calls to a customer service center last month. The mean wait was 47.7 minutes with a standard deviation of 33.14 minutes. Describe the center, and spread in context of the sampling distribution of means of random samples of 75 calls taken from this population. Relatve Frequency 035 03 025 02 015 01 005 100 120 minutes A. mean: 47.7 minutes; standard deviation: 33.14 minutes B. mean: 74 df; standard deviation: 3.83 minutes C. mean: 47.7 minutes; standard deviation: 3.83 minutes D. mean: 74 df; standard deviation: 33.14 minutes

Glencoe Algebra 1, Student Edition, 9780079039897, 0079039898, 2018
18th Edition
ISBN:9780079039897
Author:Carter
Publisher:Carter
Chapter10: Statistics
Section10.4: Distributions Of Data
Problem 19PFA

Related questions
Question
Transcribed question from image, histogram is included in the image:
Here is a histogram of waiting times of the 1,159 calls to a customer service center last month. The mean wait was 47.7 minutes with a standard deviation of 33.14 minutes. Describe the center, and spread in context of the sampling distribution of means of random samples of 75 calls taken from this population.
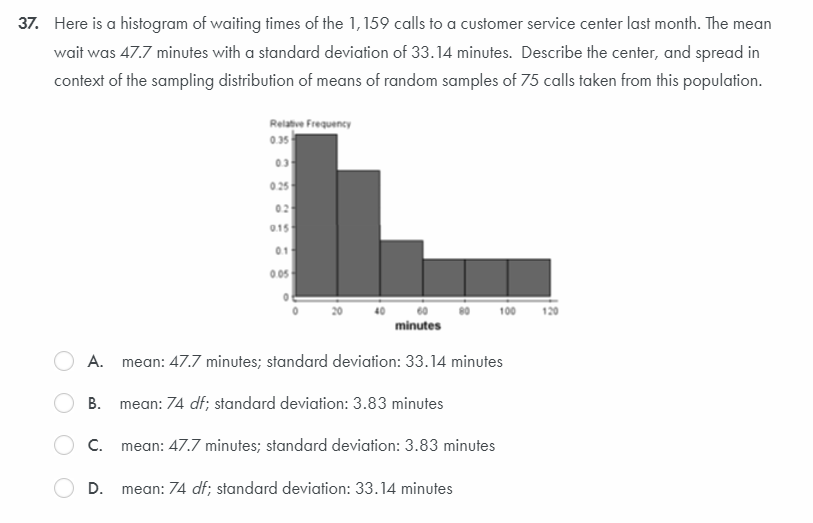
Transcribed Image Text:37. Here is a histogram of waiting times of the 1,159 calls to a customer service center last month. The mean
wait was 47.7 minutes with a standard deviation of 33.14 minutes. Describe the center, and spread in
context of the sampling distribution of means of random samples of 75 calls taken from this population.
Relatve Frequency
0.35
03
025
02
015
01
0 05
100
120
minutes
A. mean: 47.7 minutes; standard deviation: 33.14 minutes
В.
mean: 74 df; standard deviation: 3.83 minutes
C.
mean: 47.7 minutes; standard deviation: 3.83 minutes
D.
mean: 74 df; standard deviation: 33.14 minutes
Expert Solution
This question has been solved!
Explore an expertly crafted, step-by-step solution for a thorough understanding of key concepts.

This is a popular solution!

Trending now
This is a popular solution!

Step by step
Solved in 2 steps with 2 images

Recommended textbooks for you
Glencoe Algebra 1, Student Edition, 9780079039897…
Algebra
ISBN:
9780079039897
Author:
Carter
Publisher:
McGraw Hill
Glencoe Algebra 1, Student Edition, 9780079039897…
Algebra
ISBN:
9780079039897
Author:
Carter
Publisher:
McGraw Hill