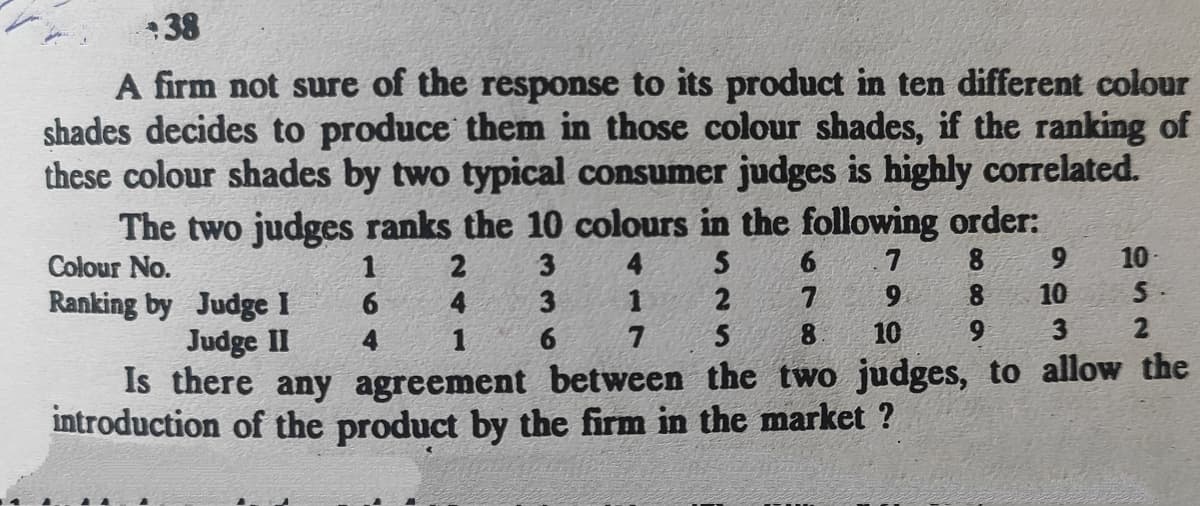
38 A firm not sure of the response to its product in ten different colour shades decides to produce them in those colour shades, if the ranking of these colour shades by two typical consumer judges is highly correlated. The two judges ranks the 10 colours in the following order: 3 Colour No. 2 4 6. 8. 10- 6. 8. 10 Ranking by Judge I Judge II 6. 4 3 1 4. 1 6. 8. 10 6. 3. Is there any agreement between the two judges, to allow the introduction of the product by the firm in the market ?


Q: Twenty different statistics students are randomly selected, For each of them, their body temperature…
A: Given r=0
Q: A market trader sells ball-point pens on his stall. He sells the pens for a different fixed price, x…
A: Hi! Thank you for the question, As per the honor code, we are allowed to answer three sub-parts at a…
Q: The ranking of 10 students in two subjects A and B are as follows: A в A B 4 8. 9. 10 3 4 7 7 10 9.…
A:
Q: 3. The ranks obtained by 10 reviewees in Engineering Mathematics and GEAS in class test as follows:…
A: We want to find rank correlation
Q: 1. The following table summarizes data collected in a study to evaluate a new screening test for…
A: According to our guidelines we can answer only three subparts, or first question and rest can be…
Q: 1. Ten competitas in a beauty contest are ranked by three judges in the following order. First…
A:
Q: on A restaurant manager believe that he sells more coffees in the morning when it is cold outside…
A:
Q: 3. The following sample contains values of the price and quantity sold of a particular commodity.…
A: Price is denoted by x Quantity sold is denoted by y Data is given for both We have to calculate…
Q: 2. The following is a set of data from a sample of n=11 items: 21 15 24 9 7 5 8 18 30 36 12 27 45 54…
A: Introduction :- Here we have to find covariance, correlation for the given data.
Q: Compute the coefficient of correlation by using the table below showing the grades of 12 learners…
A: Given We need to calculate correlation using a) Spearman’s Formula and b) Rank-Difference Method.
Q: A professor claims that students who have faster typing speed (in words per minute) tend to have…
A: Given: Sample size, n=30Sample correlation coefficient, r=0.3234
Q: Colour shades judged by Consumers. A firm not sure of the response to its product in ten different…
A: Let us find the Spearman's Rank Correlation coefficient of the given ranks by the two judges in the…
Q: The average gestational age (time from conception to birth) of a newborn infant is 40 weeks. The…
A: (a) The value of correlation between the age and birth weight is 0.9704 and it is calculated by…
Q: Compute the rank correlation coefficient for the following data of the marks obtained by 8 students…
A: Given, marks in commerce (X) 15 20 28 12 40 60 20 80 marks in mathematics (Y) 40 30 50 30 20 10…
Q: Ten students were given tests in English and Mathematics. Their marks are given below: Student No. 1…
A: Solution:
Q: - The following table gives the distribution of students according to age in completed years and…
A:
Q: The ranking of ten students in two subjects A and B are s follows: А: 3 5 4 7 10 2 1 6 6 4 9 What is…
A:
Q: A human resources personnel wants to test that people with a higher education level (in years) would…
A: We have to find test used.
Q: le 829. Ten competitors in a beauty contest are ranked by three judges in thefollowing order E 1 st…
A:
Q: 22. Compute Spearman's rank correlation for the following observation :w Candidate 4 7. Judge X 20…
A:
Q: From the following data of the marks obtained by 8 students in the Accountancy and Statistics papers…
A:
Q: e can increase the power of a correlational study by ___. Group of answer choices a. using measures…
A: A correlational study is a method of non-experimental study. In a correlational study, the…
Q: 2. Compute the Spearman rank correlation. Subject 1 2 3 4 5 6 7 8 9 10 Prelim Grade in Statistics 8…
A: Given, x y Rx Ry d=Rx-Ry d2 8 4 2 7 -5 25 9 3 1 9.5 -8.5 72.25 5 3 8 9.5 -1.5 2.25 7 4…
Q: Twenty different statistics students are randomly selected. For each of them, their body temperature…
A: We have given that 20 different statistics students are randomly selected and r = 0.
Q: A soft drink company is interested in knowing whether there is a relationship between cola…
A: Level of significance: From the given information, α=0.025 Claim: Test whether there is any…
Q: 7. Suppose X and Y are independent random variables. Y a. What is the correlation coefficient of X…
A: X and Y are independent random variable. So, Cov(X,Y) = 0 a. We need to find the correlation…
Q: The ranking of 10 students in two subjects A and B are as follows 4 8 9 10 4 7 7 10 9 8 2 1 1…
A:
Q: A random sample of 5 college students is selected and their grades in Example 3: Mathematics and…
A:
Q: Q. 13. Ten competitors in a contest were ranked by two judges in the following order: First judge 1…
A:
Q: 2. Consider the following scatterplot of midterm and final exam scores for a class of 15 students.…
A: A scatterplot is a graphical representation of the quantitative data in which two sets of data are…
Q: Compute Spearman's rank correlation for the following observation : Candidate : 1 2 3 4 5 6. 7 8…
A:
Q: A professor claims that students who have faster typing speed (in words per minute) tend to have…
A: It is given that the sample correlation is r =0.3234
Q: 6. The competitors in a beauty contest are ranked by three Judges in the following order : 1st Judge…
A:
Q: The table shows the results from a random survey asking participants their age and current systolic…
A: We have to find true statement about scatter plot.
Q: Q3. The table below presented the ranks which were assigned by three judges to the works of ten…
A: Given Information: S.no 1 2 3 4 5 6 7 8 9 10 Jud. A 5 7 4 1 3…
Q: Compute Spearman's rank correlation for the following observation : 8. Candidate : 1 3. 4 6. 20 22…
A:
Q: 28 The following are statistics recorded on the relationship between examination scores and the…
A: Positive Association- When one variable increase there is a increase in other variable Negative…
Q: The competitors in asbeauty contest are ranked by three Judges in the following order 1st Jud e 7 '6…
A:
Q: Compute Spearman's rank correlation for the following observation : Candidate : 1 2 3 4 5 6 7 8…
A: Data given X 20 22 28 23 30 30 23 24 Y 28 24 24 25 26 27 32 3
Q: 1.) In the event of Search for Miss CAS, two students were asked to ranked the 10 contestants…
A: Given data indicates the ranks of 10 contestants. The objective is to find the Spearman Rank…
Q: b. The table below presented the ranks which were assigned by three judges to the works of ten…
A: Given : Obs. NO. Judge A Judge B Judge C 1 5 4 8 2 7 8 6 3 4 3…
Q: Given the following corresponding set of data values for x and y: x 46 52 56 65 y 36 67 93 96 The…
A: Given: The values of x and y n=4
Q: A survey described the results of a poll of working adults in Canada. Each person in a random sample…
A: There are two categorical variables which are gender and days of vacation. We have to test whether…
Q: The following results are from data that were collected from the various high schools around the…
A: H0: AVERAGE CLASS SIZE, SPENDING PER STUDENT, AND AVERAGE TEACHER SALARY are not significant. H1:…
Q: what is the only plausible value of correlation r based on the following scatterplot 1 0.9 0.8 0.7
A: The scatterplot represents the relationship bet. variable X and variable Y.
Q: 2. You are given the following data of marks obtained by 11 students in statistics in two tests, one…
A: Since you have asked multiple question, we will solve the first question for you. If you want any…
Q: b) 1000 students were graded according to their IQ and Economic condition. Test whether there is…
A: The question is about categorical data analysis Given :
Q: Ten competitors in a musical test were ranked by the three judges x, y and z in the following order…
A:
Q: An art teacher is interested on the consistency of two judges who evaluated the performance of ten…
A: Calculate Correlation Coefficient r without cov(x,y) from the following data X Y 3 1 1 2 5…
Q: The following table shows the marks obtained by 10 students of a college in Accountancy (X) and…
A: Correlation: Correlation a measure which indicates the “go-togetherness” of two data sets. It can be…

Step by step
Solved in 4 steps with 3 images

- 2.Are babies born to mothers who use assistive reproduction technology (ART) more likely to be born prematurely than babies conceivednaturally? The data in the accompanying table are from a random sample of 19,614 births. Each birth was classified according to whether the mother used ART and whether the baby was premature. Use these data to decide if there is convincing evidence of an association between the use of ART and whether or not a baby ispremature. Use?=0.05.ConceivedUsing ARTConceivedNaturallyPremature1542,405Not Premature21218,843 Hypotheses: Method:Q:__________________S:__________________T:__________________N:__________________ Check: Calculate: Communicate Results:The marketing department of ABC Ltd is interested in assessing whether those people who currently buy cars from a rival do so because they view ABC’s cars as being of poor quality. In carrying out a survey, the marketing department asked 200 people two questions. Firstly, have you purchased a car from ABC in the last month? Secondly, which of the following best describes your view of the quality of cars sold by ABC? The responses to these questions are shown in the Table below. Is there evidence of an association between customers’ purchasing behaviour and their perception of the quality of cars sold by ABC Ltd? Explain your results in terms that would be comprehensible to a manager with little knowledge of statistics.a) Persons who visit the restroom of a certain fast-food outlet were asked to state theiropinion of the quality of the restroom facilities, The following tables show the responsesfrom a sample of 100 persons. Gender of Respondent Totals Quality of Facilities Male Female Above Average 8 7 15 Average 26 24 50 Below Average 7 28 35 Totals 41 59 100 A ?2 is carried out to determine whether there is an association between the gender ofpersons and their opinion. i) State appropriate null and alternative hypotheses
- Persons who visit the restroom of a certain fast-food outlet were asked to state their opinion of the quality of the restroom facilities, The following tables show the responses from a sample of 100 persons. Gender of Respondent TotalsMale FemaleQuality ofFacilitiesAbove Average 8 7 15Average 26 24 50Below Average 7 28 35Totals 41 59 100A ?2 test is carried out to determine whether there is an association between the gender of persons and their opinion.i) State appropriate null and alternative hypotheses ii) Determine the critical region of the test at the 1% level of significance iii) Calculate the expected value for Male and below average iv) For a test statistic of 9.825, explain with reason, the conclusion of your test.A soft drink company is interested in knowing whether there is a relationship between cola preference and age. A random sample of 800 people is chosen for a taste test. The results of the study are found in the following table. Is there sufficient evidence at the 0.025 level of significance to lead you to believe that there is an association between cola preference and age? Observed Sample of PeopleAge Cola A Cola B Cola C Total(15-29) 96 110 90 296(30-44) 79 106 85 270(45-59) 86 67 81 234(Total) 261 283 256 800 Step 3 of 4 : Compute the value of the test statistic. Round your answer to three decimal places, if necessary. (Note: If calculating by hand, be sure to use at least six decimal places in numbers for all intermediate calculations to ensure accuracy of the result.)The marketing executive wants to investigates the association between investment in in- centive program for employees working in corporate office and the amount of production of thier Data on a random sample of 20 corporate business were collected. Considering the amount of production as Y (in hundred dollar) and the amount for incentive as X, the following results are given: Σn xi = 27196, Σn x2 = 38198844, Σn yi = 4372, Σn y2 = 1107102, Σn xiyi = 6140313 a) Obtain the least square regression line considering appropriate dependent and indepedent variables. Interpret the slope. b) Find the estimated mean difference in the amount of production for 250 dollars difference in the amount of incentives between two corporate business c) Obtain the value of standard deviation of error. Mention what is the importance of this value in regression analysis?
- Persons who visit the restroom of a certain fast-food outlet were asked to state their opinion of the quality of the restroom facilities, The following tables show the responses rom a sample of 100 persons. Gender of Respondents TOTALS MALE FEMALE Quality of facilties Above Average 8 7 15 Average 26 24 50 Below Average 7 28 35 Totals 41 59 100 A X2 test is carried out to determine whether there is an association between the gender of persons and their opinion.i) State appropriate null and alternative hypotheses ii) Determine the critical region of the test at…Q.7: Mr. Hamood, a research scholar of Business Department in HCT, would like to find out the association between the mid-term marks, quiz marks, assignment marks and end semester marks with the Total Marks/GP obtained by the students in the final exam. He has decided to collect the data from the college students studying in the Sultanate of Oman. He came to know that there are more than 138,000 students studying in all the different colleges in Oman and realized that it is not possible to collect the data from all the students considering the time to complete the study. How will you collect the data? Discuss the instrument and process Inferential statistics is applicable. Discuss analytically490 undergraduate students at a state university in the southwestern region of the United States were surveyed. Each student in the sample was classified according to class standing (freshman, sophomore, junior, or senior) and body are category (body piercings only, tattoos only, both tattoos and body piercings, no body art). Use the data in the accompanying table to determine if there is an association between class standing and body art category. Assume that it is reasonable to regard the sample as representative of the students at this university. Use α = 0.01. 1. What type of question is this-estimation or hypothesis?2. What type of study is this sample data or experiment data?3. What type of data is this? Univariate or bivariate? Categorical or Numerical?4. How many samples or treatments?
- b) 1000 students were graded according to their IQ and Economic condition. Test whether there is any association between them or no at 5% level of significance. (Table value= 3.841)Economic conditionIQ of the Student High Low TotalRich 100 300 400Poor 350 250 600 Total 450 550 1000Be Nice to Pigeons, As They Remember Your Face In a study30 conducted in Paris, France, equal amounts of pigeon feed were spread on the ground in two adjacent locations. A person was present in both sites, with one acting hostile and running at the birds to scare them away and the other acting neutral and just observing. The two people were randomly exchanged between the two sites throughout and the birds quickly learned to avoid the hostile person's site and to eat at the site of the neutral person. At the end of the training session, both people behaved neutrally but the birds continued to remember which one was hostile. In the most interesting part of the experiment, when the two people exchanged coats (orange worn by the hostile one and yellow by the neutral one throughout training), the pigeons were not fooled and continued to recognize and avoid the hostile person. The quantity measured is difference in number of pigeons at the neutral site minus the hostile site. With n = 32…Of 2,872 persons who had received radiation treatment in childhood because of an enlarged thymus, cancer of the thyroid developed in 24 and a benign thyroid developed in 52. A comparison group consisted of 5,055 children who had received no such treatment (brothers and sisters of the children who had received radiation treatment). During the follow-up period, non of the comparison developed thyroid cancer, but benign thyroid tumors developed in 6. Calculate the relative risk for benign thyroid tumors. Round your answer to the nearest whole number I need typed answer with explanation D

