4. 74, 63, 69, 62, 33, 79, 70, 60, 107, 119 Median: Q3: Q1: IQR: Outliers:

Glencoe Algebra 1, Student Edition, 9780079039897, 0079039898, 2018
18th Edition
ISBN:9780079039897
Author:Carter
Publisher:Carter
Chapter10: Statistics
Section10.3: Measures Of Spread
Problem 21PFA

Related questions
Question
Do number 4
This is not graded
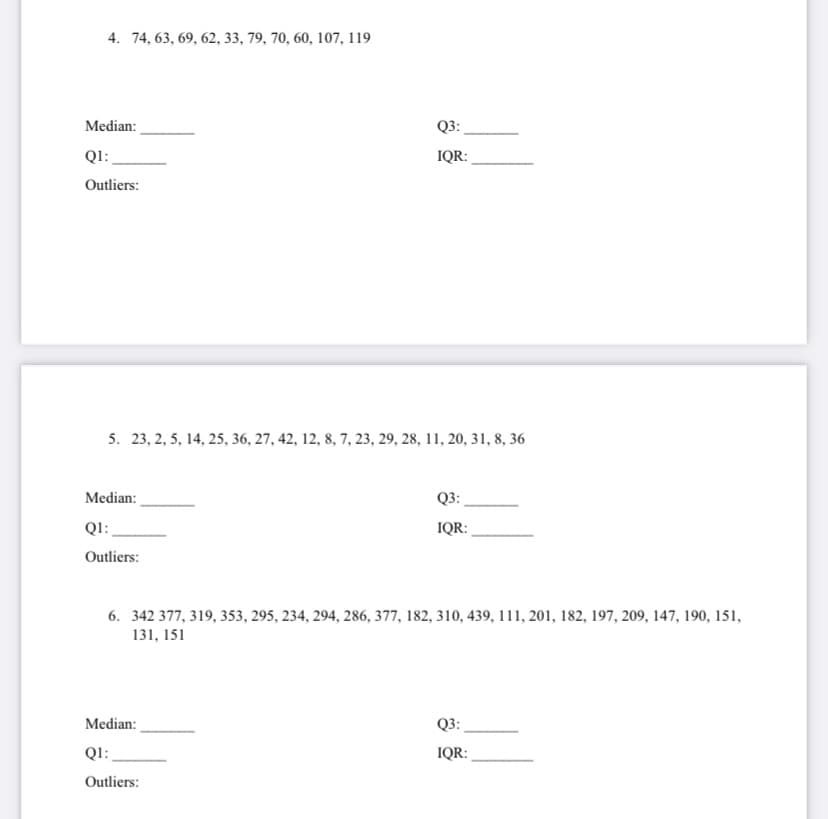
Transcribed Image Text:4. 74, 63, 69, 62, 33, 79, 70, 60, 107, 119
Median:
Q3:
QI:
IQR:
Outliers:
5. 23, 2, 5, 14, 25, 36, 27, 42, 12, 8, 7, 23, 29, 28, 11, 20, 31, 8, 36
Median:
Q3:
Q1:
IQR:
Outliers:
6. 342 377, 319, 353, 295, 234, 294, 286, 377, 182, 310, 439, 111, 201, 182, 197, 209, 147, 190, 151,
131, 151
Median:
Q3:
Q1:
IQR:
Outliers:
Expert Solution
This question has been solved!
Explore an expertly crafted, step-by-step solution for a thorough understanding of key concepts.

This is a popular solution!

Trending now
This is a popular solution!

Step by step
Solved in 2 steps

Recommended textbooks for you
Glencoe Algebra 1, Student Edition, 9780079039897…
Algebra
ISBN:
9780079039897
Author:
Carter
Publisher:
McGraw Hill

Holt Mcdougal Larson Pre-algebra: Student Edition…
Algebra
ISBN:
9780547587776
Author:
HOLT MCDOUGAL
Publisher:
HOLT MCDOUGAL
Glencoe Algebra 1, Student Edition, 9780079039897…
Algebra
ISBN:
9780079039897
Author:
Carter
Publisher:
McGraw Hill
Holt Mcdougal Larson Pre-algebra: Student Edition…
Algebra
ISBN:
9780547587776
Author:
HOLT MCDOUGAL
Publisher:
HOLT MCDOUGAL