4. A researcher wanted to examine the effect of a new math study skills program on second graders Fifteen students took the new study skills program for six weeks and then took a standardized math exam, which is known to have a population mean score of u 80. The scores on the exam for the 15 students (who took the study skills program) are reported below. Scores on the standardized math exam for the 15 students: 79, 85, 86, 75, 82, 84, 85, 81, 75, 84, 78, 90, 85, 83, 80 Test to see whether the students who took the new study skills program have significantly higher test scores than the national average. Perform the appropriate test in SPSS using a.05 a. State the null and alternative hypotheses below. The null and the alternative hypotheses are given below The mean test seore of the sample students is H us80 lesser than or cqual to 80 The mean test score of the sample students H 80 is greater than 80 b. What type of test should be run on the data (be specific with the exact name of the test)? For example, don't just state " test," but the specific ftest used. One sample t-test is used to test whether the population mean differs significantly from the hypothesized value. In this case the hypothesized value is 80. By using the sample data the population mean is tested. Hence, one sample t-test is used. c. What is the conclusion of the hypothesis test? State the p-value and the decision about the hypothesis test below. (Don't write the results here -that will be done in (d) below -just statep and whether Ho is rejected.) The corresponding p-value for the test statistic 1.98 at 14 degrees of freedom is 0.033 and it is calculated by using excel software: Decision rule: Reject the null hypothesis (Ho) when the caleulated p-value of the test statistic is lesser than the level of significance a. Conclusion Since the obtained p value for the test statistic 0.033 is less than the level of significance (a-0.05), the null hypothesis is rejected and concluded that the new study skills program have significantly higher test scores than the national average d. What is the effect size for the study? Calculate and report the effect size below. Indicate the magnitude of the effect size according to Cohen's standards and interpret what the effect size means in terms of standard deviation units. e. Write the results of the test in APA format below.
4. A researcher wanted to examine the effect of a new math study skills program on second graders Fifteen students took the new study skills program for six weeks and then took a standardized math exam, which is known to have a population mean score of u 80. The scores on the exam for the 15 students (who took the study skills program) are reported below. Scores on the standardized math exam for the 15 students: 79, 85, 86, 75, 82, 84, 85, 81, 75, 84, 78, 90, 85, 83, 80 Test to see whether the students who took the new study skills program have significantly higher test scores than the national average. Perform the appropriate test in SPSS using a.05 a. State the null and alternative hypotheses below. The null and the alternative hypotheses are given below The mean test seore of the sample students is H us80 lesser than or cqual to 80 The mean test score of the sample students H 80 is greater than 80 b. What type of test should be run on the data (be specific with the exact name of the test)? For example, don't just state " test," but the specific ftest used. One sample t-test is used to test whether the population mean differs significantly from the hypothesized value. In this case the hypothesized value is 80. By using the sample data the population mean is tested. Hence, one sample t-test is used. c. What is the conclusion of the hypothesis test? State the p-value and the decision about the hypothesis test below. (Don't write the results here -that will be done in (d) below -just statep and whether Ho is rejected.) The corresponding p-value for the test statistic 1.98 at 14 degrees of freedom is 0.033 and it is calculated by using excel software: Decision rule: Reject the null hypothesis (Ho) when the caleulated p-value of the test statistic is lesser than the level of significance a. Conclusion Since the obtained p value for the test statistic 0.033 is less than the level of significance (a-0.05), the null hypothesis is rejected and concluded that the new study skills program have significantly higher test scores than the national average d. What is the effect size for the study? Calculate and report the effect size below. Indicate the magnitude of the effect size according to Cohen's standards and interpret what the effect size means in terms of standard deviation units. e. Write the results of the test in APA format below.

Glencoe Algebra 1, Student Edition, 9780079039897, 0079039898, 2018
18th Edition
ISBN:9780079039897
Author:Carter
Publisher:Carter
Chapter10: Statistics
Section10.3: Measures Of Spread
Problem 1GP

Related questions
Topic Video
Question
I have attached a picture of the question. Please answer section D and E only which are the questions below.
d. What is the effect size for the study? Calculate and report the effect size below. Indicate the magnitude of the effect size according to Cohen’s standards and interpret what the effect size
e. Write the results of the test in APA format below.
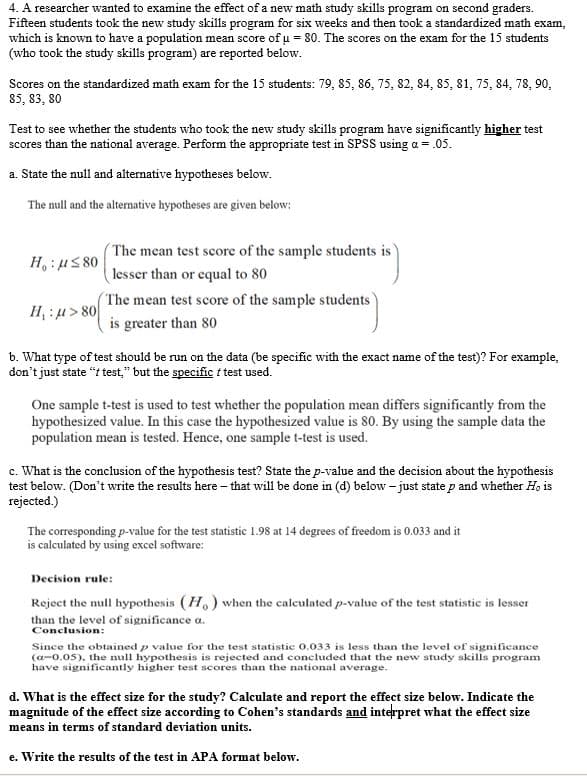
Transcribed Image Text:4. A researcher wanted to examine the effect of a new math study skills program on second graders
Fifteen students took the new study skills program for six weeks and then took a standardized math exam,
which is known to have a population mean score of u 80. The scores on the exam for the 15 students
(who took the study skills program) are reported below.
Scores on the standardized math exam for the 15 students: 79, 85, 86, 75, 82, 84, 85, 81, 75, 84, 78, 90,
85, 83, 80
Test to see whether the students who took the new study skills program have significantly higher test
scores than the national average. Perform the appropriate test in SPSS using a.05
a. State the null and alternative hypotheses below.
The null and the alternative hypotheses are given below
The mean test seore of the sample students is
H us80
lesser than or cqual to 80
The mean test score of the sample students
H 80
is greater than 80
b. What type of test should be run on the data (be specific with the exact name of the test)? For example,
don't just state " test," but the specific ftest used.
One sample t-test is used to test whether the population mean differs significantly from the
hypothesized value. In this case the hypothesized value is 80. By using the sample data the
population mean is tested. Hence, one sample t-test is used.
c. What is the conclusion of the hypothesis test? State the p-value and the decision about the hypothesis
test below. (Don't write the results here -that will be done in (d) below -just statep and whether Ho is
rejected.)
The corresponding p-value for the test statistic 1.98 at 14 degrees of freedom is 0.033 and it
is calculated by using excel software:
Decision rule:
Reject the null hypothesis (Ho) when the caleulated p-value of the test statistic is lesser
than the level of significance a.
Conclusion
Since the obtained p value for the test statistic 0.033 is less than the level of significance
(a-0.05), the null hypothesis is rejected and concluded that the new study skills program
have significantly higher test scores than the national average
d. What is the effect size for the study? Calculate and report the effect size below. Indicate the
magnitude of the effect size according to Cohen's standards and interpret what the effect size
means in terms of standard deviation units.
e. Write the results of the test in APA format below.
Expert Solution
This question has been solved!
Explore an expertly crafted, step-by-step solution for a thorough understanding of key concepts.

This is a popular solution!

Trending now
This is a popular solution!

Step by step
Solved in 4 steps with 3 images

Knowledge Booster


Learn more about
Need a deep-dive on the concept behind this application? Look no further. Learn more about this topic, statistics and related others by exploring similar questions and additional content below.Recommended textbooks for you
Glencoe Algebra 1, Student Edition, 9780079039897…
Algebra
ISBN:
9780079039897
Author:
Carter
Publisher:
McGraw Hill
Glencoe Algebra 1, Student Edition, 9780079039897…
Algebra
ISBN:
9780079039897
Author:
Carter
Publisher:
McGraw Hill