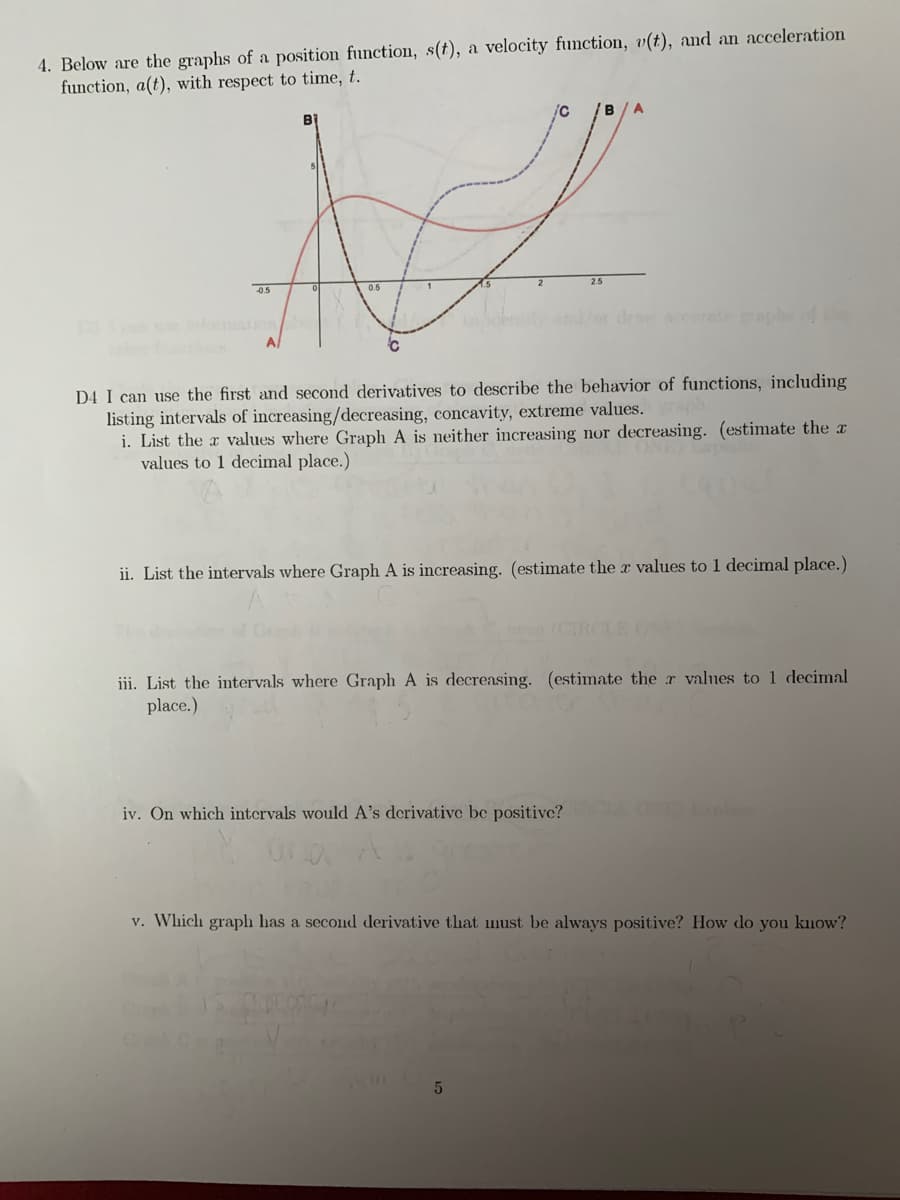
4. Below are the graphs of a position function, s(t), a velocity function, v(t), and an acceleration function, a(t), with respect to time, t. 0.5 0.5 2.5 teape of A D4 I can use the first and second derivatives to describe the behavior of functions, including listing intervals of increasing/decreasing, concavity, extreme values. i. List the a values where Graph A is neither increasing nor decreasing. (estimate the a values to 1 decimal place.) ii. List the intervals where Graph A is increasing. (estimate the r values to 1 decimal place.) iii. List the intervals where Graph A is decreasing. (estimate the r values to 1 decimal place.) iv. On which intervals would A's derivative be positive? v. Which graph has a second derivative that must be always positive? How do you know?


Rate of Change
The relation between two quantities which displays how much greater one quantity is than another is called ratio.
Slope
The change in the vertical distances is known as the rise and the change in the horizontal distances is known as the run. So, the rise divided by run is nothing but a slope value. It is calculated with simple algebraic equations as:
i.
The function is neither increasing or decreasing at the maxima or minima.
Graph B represents the first derivative of function given by graph A. So, the maxima, or, minima for graph A occurs when graph B intersects the x-axis.
So, the graph A is neither increasing or, decreasing at , which are maxima and minima, respectively.
ii.
The Graph A is increasing on the intervals: .
iii.
The Graph A is decreasing on the interval: .

Trending now
This is a popular solution!

Step by step
Solved in 2 steps


