4. Do the followings with R: a. Create a plot of the pf of X. b. Create a plot of the cdf of X. c. Draw a random sample of size 1000 from Binomial(n = 3, p = 0.4). Then plot a histogram calculate the sample mean and the sample variance. Comment briefly on these outputs comp
4. Do the followings with R: a. Create a plot of the pf of X. b. Create a plot of the cdf of X. c. Draw a random sample of size 1000 from Binomial(n = 3, p = 0.4). Then plot a histogram calculate the sample mean and the sample variance. Comment briefly on these outputs comp

Algebra and Trigonometry (MindTap Course List)
4th Edition
ISBN:9781305071742
Author:James Stewart, Lothar Redlin, Saleem Watson
Publisher:James Stewart, Lothar Redlin, Saleem Watson
Chapter14: Counting And Probability
Section14.2: Probability
Problem 3E: The conditional probability of E given that F occurs is P(EF)=___________. So in rolling a die the...

Related questions
Question
just q 4's a b and c please thank you
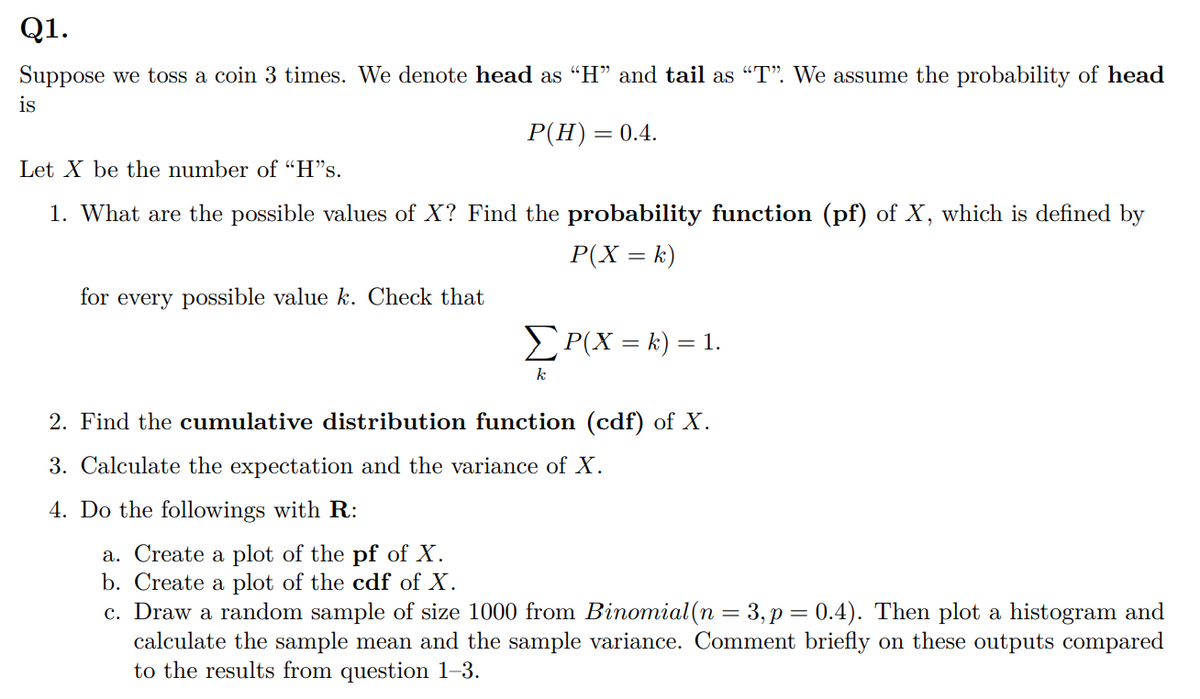
Transcribed Image Text:Q1.
Suppose we toss a coin 3 times. We denote head as “H" and tail as "T". We assume the probability of head
is
Р(Н) — 0.4.
Let X be the number of "H*s.
1. What are the possible values of X? Find the probability function (pf) of X, which is defined by
P(X = k)
for every possible value k. Check that
EP(X = k) =
= 1.
k
2. Find the cumulative distribution function (cdf) of X.
3. Calculate the expectation and the variance of X.
4. Do the followings with R:
a. Create a plot of the pf of X.
b. Create a plot of the cdf of X.
c. Draw a random sample of size 1000 from Binomial(n = 3,p= 0.4). Then plot a histogram and
calculate the sample mean and the sample variance. Comment briefly on these outputs compared
to the results from question 1–3.
Expert Solution
This question has been solved!
Explore an expertly crafted, step-by-step solution for a thorough understanding of key concepts.

Step by step
Solved in 3 steps with 7 images

Recommended textbooks for you
Algebra and Trigonometry (MindTap Course List)
Algebra
ISBN:
9781305071742
Author:
James Stewart, Lothar Redlin, Saleem Watson
Publisher:
Cengage Learning

College Algebra
Algebra
ISBN:
9781305115545
Author:
James Stewart, Lothar Redlin, Saleem Watson
Publisher:
Cengage Learning

College Algebra (MindTap Course List)
Algebra
ISBN:
9781305652231
Author:
R. David Gustafson, Jeff Hughes
Publisher:
Cengage Learning
Algebra and Trigonometry (MindTap Course List)
Algebra
ISBN:
9781305071742
Author:
James Stewart, Lothar Redlin, Saleem Watson
Publisher:
Cengage Learning
College Algebra
Algebra
ISBN:
9781305115545
Author:
James Stewart, Lothar Redlin, Saleem Watson
Publisher:
Cengage Learning
College Algebra (MindTap Course List)
Algebra
ISBN:
9781305652231
Author:
R. David Gustafson, Jeff Hughes
Publisher:
Cengage Learning

Algebra & Trigonometry with Analytic Geometry
Algebra
ISBN:
9781133382119
Author:
Swokowski
Publisher:
Cengage