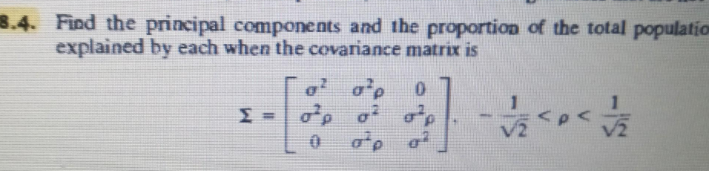
4. Find the principal components and the proportion of the total popu explained by each when the covariance matrix is o o'p


Q: [M] The Demographic Research Unit of the California State Department of Finance supplied data for…
A:
Q: Data from 10 individuals in renal failure with high blood pressure are shown in the following table.…
A:
Q: 2.28 The following data give the number of turnovers (fumbles and interceptions) by a ecollege…
A: The single-value classes means each class has one observation only. The frequency is the number of…
Q: Suppose three tests are administered to a random sample of college students. Let X1, ..., XN be…
A:
Q: (b) Let X - 3 (u, E) with the date matrix [5 3 4 || x1 X =|2 1 3 X2 Find the variance- 5 6 4x3…
A:
Q: The following table contains the population at each center: 4 5 6 7 8 7 8 8 3 6 15 Center I 2 3 9.…
A: The 6 centers with highest population are (in decreasing order): 3, 10, 12, 6, 11, (7 or 5) with…
Q: Which of these four forecasts seems to have the most bias? A. (6,4,3,2) B. 3-period moving average…
A: Introduction: Given that the four forecasts are: (6, 4, 3, 2), 3P avg, Alpha 0.3 and SMA. One of the…
Q: (b) (i) Create boxplots for these two data sets (either drawn by hand or as a printout from…
A:
Q: (a) The following diagram shows the movement of Kenyan households among three income groups:…
A: (a) Since you have asked multiple questions, we will solve the first question for you. If you want…
Q: In a Bernoulli process with success rate .4, if we consider the total number of successes X which…
A: From the given information, X Y x-mean(x) y-mean(y) [x-mean(x)][y-mean(y)] 7 15 -7 -15.2 106.4…
Q: matrix for a portfolio with 50 stocks requires the calculations of ____ variances an
A: Given that the σ_AB= σ_BA, then the variance-covariance matrix for a portfolio with 50 stocks…
Q: [M] The covariance matrix below was obtained from a Landsat image of the Columbia River in…
A:
Q: Suppose a researcher is interested in investigating the effectiveness of a new medication aimed to…
A:
Q: sample covariance matrix S as s- () 4 S = 6
A: We know that , in 2*2 order matrix to obtain the correlation matrix from the covariance matrix, We…
Q: 3. The following boxplots display data on lightbulb lifetimes for three brands (A, B, and C).
A: HERE GIVEN BOXPLOTS OF THE THREE BRANDS A,B,C OF LIGHTBULBS. NOTE-AS PER POLICY I HAVE…
Q: Nuclear power: The following table presents the number of nuclear reactors as of August 2, 2013, In…
A: Mean, Median and Mode are measures of central tendency.
Q: 5.33 Refer to Exercise 5.27 and calculate the covariance between X and Y.
A: 5.33) Given that, The joint probability density function of X, Y and Z is,…
Q: 1. Compares the number of males to the number of females 1) Sex structure: Sex Composition 2) Sex…
A: Given problem Given that 1) Compares the number of males to the number of females Ans) Sex…
Q: The following are two visualizations of the percentage of people who have access to health care in…
A: The visualization 1 has no particular scale and the depiction is not clear. Such avst difference in…
Q: Consider the following data related to the employees ,who are on travel. 40% check work email, 20%…
A: Given:40% check work email20% use cell phone25% bring laptop 23% check both work email and use cell…
Q: Suppose the random variables X,,X2,X; have the population variance/covariance matrix: 1 -2 0 E=-2 0…
A:
Q: A fair coin is flipped 4 times. If X and Y are the number of heads and tails obtained, respectively,…
A:
Q: - If P(X,) =0.4 feed to the transition channel shown beside find the joint probability matrix.
A: Note: Hi there! Thank you for posting the question. As your question has 6 different questions, as…
Q: If the transformation matrix is 1 -1 -2 2 -1 [T] = -2 -1 -2 3 find the covariance matrix of the new…
A:
Q: Convert the matrix of observations to mean-deviation form, and construct the sample covariance…
A: By using formulaes and matrix calculations you can solve the given problem as follows :
Q: Chapter 1. Truist Bank started its operations in April 2020. Since then, they have collected monthly…
A: The following table is given below:
Q: 2. Calculate the covariance matrix using the following four samples. 5.1 4.9 /5.2 3.5 3.0 3.8 X =…
A: Use the following formulae, to obtain the solution. Mean, x¯=∑i=1nxinVariance,…
Q: Three market leaders in homeowners insurance in a state are State Farm, American Family Insurance…
A: From the given information, the sum of x, y, z and w is 100. That is, x+y+z+w=100. x+y+z=100-w…
Q: 2 4 9 1 1 5' 5' 5' 10' 2 10 2. Compute s and s for the data set:
A: Given data The mean of the data is calculated as shown below
Q: 1. An educator believes that students choosing to major in mathematics, engineering, chemistry,…
A: Given Information:
Q: Given that £p =(13.3 5.55) for the sample of forged ten 5.8 5.55 pound notes, calculate the pooled…
A:
Q: 4. Calculate SS,ptal SSpetweens and SSwithin for the following set of data: betwi Treatment 1…
A: Given data Treatment 1 Treatment 2 Treatment 3 n=10 n=10 n=10 N=30 T = 10…
Q: Question 1. Consider a p-dimensional response variable j, containing p variables, with n observation…
A: Given, a 3X3 data matrix containing three observations of three variables y1 , y2 and y3 .…
Q: Three market leaders in homeowners insurance in a state are State Farm, American Family Insurance…
A: Two relationships between the homeowner's insurance percentage market shares are found to be as…
Q: The following data consists of a matrix of transition probabilities (P) of three competing…
A:
Q: Construct a model of population flow between metropolitan and nonmetropolitan areas of the United…
A: The initial population distribution (in millions) vector is given as x0 = [255, 52] Population in…
Q: 7.5. Given the variance-covariance matrix of three random variables X1, X2 and X3, E = [4 1 2 1 9.…
A:
Q: 3. Draw the adjacency matrix for the graph below: | 10 4 40 20 8 20 2 10 2 4 10 12 10 6 9. 4. 3.
A:
Q: Three market leaders in homeowners insurance in a state are State Farm, American Family Insurance…
A: Given the linear equations, x=−86+5y+z z=18−2y+w Here, x, y, z and w are the percentages of the…
Q: A scatterplot is shown. 12 10 8. 4 X 2 4 6 8 10 12 What statement about the scatterplot is true? A…
A: To find the association between x and y on the scatter plot.
Q: n Development Report gives the following data for real GDP per person in 2018: China, $15,270;…
A: In this case, we know that in US and Canada the real GDP per capita is higher, hence they are ranked…
Q: Suppose Z,,Z,,Z¸ are standardized variables with 6. ( 1 0.8 0 covariance matrix p= 0.8 0 1 (a) (b)…
A:
Q: The table below contains the covariance matrix of stock returns and the market. Assume that the…
A: Given data, The table below contains the covariance matrix of stock returns and the market. Assume…
Q: d Thompson, 2 the Land of Oz is blessed by many things, but i ice days in a row. If they have a nice…
A: *Answer:
Q: Suppose that the students just completing freshman year at Galton University have Math SAT scores…
A: Introduction: It is mentioned that the scatterplot of the two variables is in an oval-shaped cloud…
Q: 11: Motorman Corporation is contemplating the accompanying creation method along with different…
A:
Q: PART B. Consider the following correlation matrix: Extraversion Extraversion Neuroticism Neuroticism…
A: From the correlation matrix, The correlation between Extraversion and Neuroticism is 0.15. Here, the…
Q: Given data points (2,-1), (2, 1), (3,2), (0,-1), and (3,-1), compute the sample covariance matrix.…
A:
Q: Which of the following is correct about Factorial Designs? A. If there are no main effects, there…
A: Given that - Which of the following is correct about Factorial Designs? A. If there are no main…
Pls help


Trending now
This is a popular solution!

Step by step
Solved in 2 steps with 2 images

- 2. Suppose that in Example 2.27, 400 units of food A, 500 units of B, and 600 units of C are placed in the test tube each day and the data on daily food consumption by the bacteria (in units per day) are as shown in Table 2.7. How many bacteria of each strain can coexist in the test tube and consume all of the food? Table 2.7 Bacteria Strain I Bacteria Strain II Bacteria Strain III Food A 1 2 0 Food B 2 1 3 Food C 1 1 1Suppose that the index model for two Canadian stocks HD and ML is estimated with the following results: RHD =-0.03+2.10RM+eHD R-squared =0.7 RML =0.06+1.60RM+eML R-squared =0.6 σM =0.15 where M is S&P/TSX Comp Index and RX is the excess return of stock X. What is the covariance and the correlation coefficient between HD and ML?Given that the σ_AB= σ_BA, then the variance-covariance matrix for a portfolio with 50 stocks requires the calculations of ____ variances and ____ covariances.
- Suppose that the index model for two Canadian stocks HD and ML is estimated with the following results: RHD =-0.03+2.10RM+eHD R-squared =0.7 RML =0.06+1.60RM+eML R-squared =0.6 σM =0.15 where M is S&P/TSX Comp Index and RX is the excess return of stock X. What is the covariance and the correlation coefficient between HD and ML? For portfolio P with investment proportion of 0.4 in HD and 0.6 in ML, calculate the systematic risk, non-systematic risk, and total risk of P.If two stocks have variance σ2=16 each, could their covariance be equal to σ12 = 20Suppose two subject scores (Python, Java) for five students have the following values: Python Java Student 1 4 6 Student 2 2 5 Student 3 10 8 Student 4 7 5 Student 5 4 3 Find covariance of Python and Java. (Your answer should be the nearest to one-hundredth, e.g., 123.45)
- Suppose that index model for Stocks A and B is estimated from excess returns with the following results : Ra 0.04 +0.6Rm+ea , Rb = - 0.04 + 1.3Rm + eb Risk on the market is 30% , R-squared of A is 30%R - squared of B is 40% , security A residual variance isch 13. 5: Cincinnati Paint Company sells quality brands of paints through hardware stores throughout the United States. The company maintains a large sales force who call on existing customers and look for new business. The national sales manager is investigating the relationship between the number of sales calls made and the miles driven by the sales representative. Also, do the sales representatives who drive the most miles and make the most calls necessarily earn the most in sales commissions? To investigate, the vice president of sales selected a sample of 25 sales representatives and determined: The amount earned in commissions last month (y) The number of miles driven last month (x1) The number of sales calls made last month (x2) The information is reported below. Commissions ($000) Calls Driven Commissions ($000) Calls Driven 29 139 2,371 27 146 3,290 26 132 2,226 25 144 3,103 28 144 2,731 29 147 2,122 26 142 3,351 25 144 2,791 29 142 2,289 25 149 3,209 28…The owner of a pet store is trying to decide whether to discontinue selling specialty clothes for pets. She suspects that only 10% of the customers buy specialty clothes for their pets and thinks that she might be able to replace the clothes with more interesting and profitable items on the shelves. Before making a final decision she decides to keep track of the total number of customers for a day, and whether they purchase specialty clothes for their pet. a) Assuming the pet store owner is correct in thinking that only 10% of her customers purchase specialty clothes for their pets, how many customers should she expect before someone buys a garment for their pet? b) What is the probability that she does not sell a garment until the 5th customer? c) What is the probability that exactly 4 of the first 10 customers buy specialty clothes for their pet? d) What is the probability that at least 3 of the first 35 customers buy specialty clothes for their pet?…
- A covariance of 0.01 between data set A and data set B indicates: A strong tendency for B to increase when A increases A weak relationship between A and B A strong tendency for B to decrease when A increases Not enough information to sayAssume that as a portfolio manager the beta of your portfolio is 1.15 and that your performance is exactly on target with the SML data under condition 1. If the true SML data is given by condition 2, how much does your performance differ from the true SML? (1) RFR = 0.0625 Rm(proxy) = 0.12 (2) RK = 0.078 Rm(true) = 0.10Suppose that weights of college mathematics textbooks in the United States are normally distributed with mean µ = 2.25 lbs and variance σ2 = 0.2025 lbs. Find the weight that corresponds to Q3 and interpret this measure of position in the context of the problem.