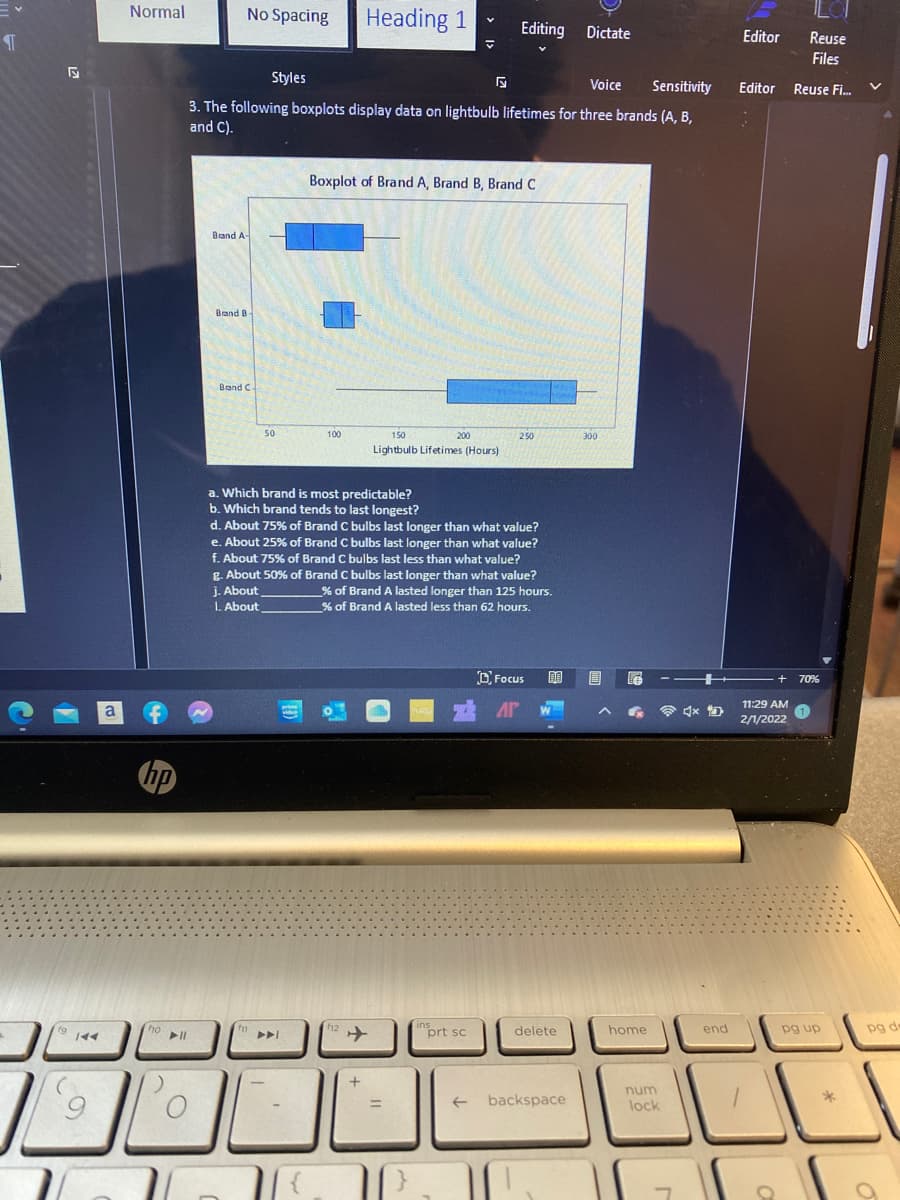
3. The following boxplots display data on lightbulb lifetimes for three brands (A, B, and C).
Q: Consider the following table:
A: Note: Since you have posted a question with multiple subparts, we will solve the first three…
Q: 2. Which region has the most annual income A Northern B Midland C Southern D Eastern E Western
A: Total Number of Houses in each region = Number of State Owned Houses + Number of Private Houses…
Q: Please see question attached.
A: From given data, Total no of people= 118752 No of persons who are male and age is between 25-34 is…
Q: 2.28 The following data give the number of turnovers (fumbles and interceptions) by a ecollege…
A: The single-value classes means each class has one observation only. The frequency is the number of…
Q: QOCH.A The number of cell phones per 100 residents in countries in Europe is given in Table #1 for…
A:
Q: The following results represent a monthly income of 15 Omani riyals and an average monthly phone…
A: Note: Hi there! Thank you for posting the question. As your question has more than 3 parts, we have…
Q: Answer a,b,c
A:
Q: Organize these costs as an ordered array. b. Construct a frequency distribution and a percentage…
A: Given, a) Ordered the data in ascending order are provided below and the required values are…
Q: . The following Table show the number of hours worked by 200 statistics students: Number of Hours…
A:
Q: complete the following table
A: Given: h=0.1, 0.001, 0.0001, 10-6, 10-15, 10-18, 10-20 To find: The values in following table,
Q: 12. Compute the amount of information and the redundancy of the following data presented in the…
A:
Q: The following table shows the number of automobile crashes in Durham county by year 2016 2017 2011…
A: y = m*x+b Here ,n=10, ∑x=20125 , ∑y=84982, ∑xy=171055545,∑x2=40501645,∑y2=734303418…
Q: The hospital wants to know if their budget is sufficient by checking whether the above frequencies…
A: Test is that whether the given frequencies fit the data from their records.
Q: 1) The Mars Candy Company has two manufacturing facilities. One in Tennessee and one in New Jersey.…
A: Hello! As you have posted more than 3 sub parts, we are answering the first 3 sub-parts. In case…
Q: A doctor mal table below s
A: Introduction: In mathematics, an exponential function is a relationship of the type y = aebx, with…
Q: The distribution of number of stores according to size in 3 areas is given in the following table:…
A: No. of L stores = 50+150+20=220 No. of M stores =50+105+130=285 No. of S stores =75+260+150=485…
Q: Table 1.3 The following figures, released by the Federal Trade Commission, show the milligrams of…
A: Given data is: .
Q: The following table lists the population of various bird species in a local zoo, separated by their…
A:
Q: 10 The following table shows how many people immigrated to Ireland from 2010 to 2014. Year 2010 201…
A:
Q: Consider the following data set for an office structure built by Anderson Construction Co. The…
A: Given in the data, Let FLRCOM is the number of floors completed. Let Hours be the cumulative labor…
Q: Facebook applications: Suppose that the following table presents the number of monthly users for…
A: Given data of monthly users is 17.9,20.2,18.5,15,28,19.3,24.5,23.2,35
Q: The following table contains the number of complaints received in a department store for the first 6…
A: The idea behind the naive method for forecasting is to simply choose the data value from the…
Q: 1 Evaluate 士V16 目 ?/1 (Level 2) Show Your Work
A:
Q: ) The following data shows how many employees showed up to work every day for two weeks 12 18 09 16…
A: Given,sample size(n)=14sample mean(x¯)=12+18+9+16+11+10+8+10+13+11+15+17+16+1114sample…
Q: 3.20 Table 3.3 shows the number of athletes who stretch before exercising and how many had injuries…
A:
Q: Table 2.2 Number of susceptible and infected individuals during the Great Plague of Eyam Date 1666…
A: By SIR model for spread of disease dependent and independent variables are identified. The…
Q: Product Information for 10 Tablet Computers Cost ($) Operating System Display Size (inches) Battery…
A: Average is a single value that represents the entire mass mean value is the sum of observation…
Q: In a simulation of 30 mobile computer networks, the average speed, pause time, and number of…
A: Hi! Thank you for the question, As per the honor code, we are allowed to answer three sub-parts at a…
Q: The following chart shows "living wage" jobs in Rochester per 1000 working age adults over a 5 year…
A: The given chart is:
Q: The data to the right contain the per-capita energy consumption, in kilowatt-hours, for each of the…
A: We want to find mean , population standards deviation and population variance
Q: 3. The following table gives home values of 10 homes in three neighborhoods: Neighborhood A $800,000…
A: The Law of Iterated Expectation states that: E(X) =…
Q: The following table gives the cost of living index numbers for different commodity groups together…
A:
Q: "*1. The following Table gives the population of a town during the last 5 censuses. EstipiRe une…
A:
Q: 1. Calculate the batting runs for the top five home run hitters of all time, for the season in which…
A: We will use basic knowledge of logic to answer this question.
Q: Product Information for 10 Tablet Computers Cost Operating Display Size Battery Life (inches) CPU…
A: The percentage of favorable outcomes can be given by the product of the ratio of number of favorable…
Q: a. Confirm the intercept, slope and correlation coefficient by computing them.
A: Income (X) Units (Y) (x-xbar) (x-xbar)^2 (y-ybar) (y-ybar)^2 (x-xbar)*(y-ybar) 16368 1190882…
Q: 12. The following table gives the quantity of cement in thousands of tonnes mamuferctured each year…
A:
Q: #10. The following data represent annual salaries, in thousands of dollars, for employees of a small…
A: “Since you have asked multiple questions, we will solve the first question for you. If you want any…
Q: The following table shows how many weeks a sample of 6 persons have worked at an automobile…
A: a) Least square equation: Excel Procedure: Enter X and Y data in Excel Go to Data Click on Data…
Q: The owner of a chain of mini-markets wants to compare the sales performance of two of her stores,…
A: From the provided information, Sample size (n) = 10 Level of significance (α) = 0.05
Q: An Internet Service Provider (ISP) offers three plans, High Speed (H), Medium Speed (M) and Low…
A: ISP changing plan using transition matrix A, using the given data set we make transition matrix A…
Q: The following data represent the length of life in years of 40 fuel pumps. 4.1, 2.2, 4.1, 3.5, 4.5,…
A: a) Grouped frequency distribution is constructed below: class interval Frequency 1-2 2 2-3 7…
Q: The table below shows automatic weapons and Northwestern states. X Y 11.8 8.6 14.1 11.5 thousands of…
A: The given data is x y 11.8 14.1 8.6 11.5 7 9.8 3.3 7.1 2.5 6.2 2.5 6.5 2.6 6 0.9…
Q: Enter the following table into your calculator or the Desmos Grapher and create the scatterplot. 2…
A:
Q: The table gives the number of yeast cells in a new laboratory culture.
A: Given information: Given data represents the values of time in hours and corresponding number of…
Q: Listed are the net sales for a San Francisco-area mail-order retailer for the years 2009 to 2018.…
A: Given : Year Sales(millions) 2009 486.6 2010 506.8 2011 522.2 2012 574.6 2013 580.7…
Q: A population starts with 16 carpet beetles and in a week the population increase by 1 new beetle for…
A: given data is Week 0 week 1 week 2 week 3 week 4 week 5 16 20 25 31 39 49 according to…
Q: 12. Which of these areas is a minor sector?
A: A sector is a portion that is bounded by two radii and an arc. The smaller portion is called a minor…
HERE GIVEN
BOXPLOTS OF THE THREE BRANDS A,B,C OF LIGHTBULBS.
NOTE-AS PER POLICY I HAVE CALCULATED FIRST 3 SUBPARTS PLZ RESUBMIT OTHER PARTS AGAIN
Trending now
This is a popular solution!
Step by step
Solved in 4 steps