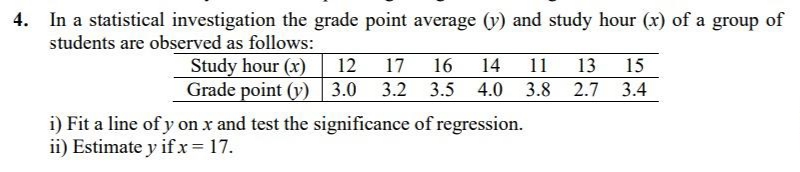
4. In a statistical investigation the grade point average (y) and study hour (x) of a group of students are observed as follows: Study hour (x) Grade point (v) 12 17 16 14 11 13 15 3.0 3.2 3.5 4.0 3.8 2.7 3.4 i) Fit a line of y on x and test the significance of regression. ii) Estimate y if x = 17.


Q: Use the information given to find the appropriate minimum sample size. (Round your answer up to the…
A:
Q: Question 5: You are playing 5 card poker with your friends. In this game you are initially dealt 5…
A: Given information: The game is about 5-card poker. A standard deck contains 52 cards. The first hand…
Q: Henry and Samantha have decide to gamble on a game of chance. Initially, each of them has 2 dollars.…
A: We can model the progress of the game as a Markov chain with states (i,j) representing the amount of…
Q: Please show me the answer of question I and II
A: Given data: Group A Group B 49 133 108 108 110 93 82 119 93 119 114 98 134 106…
Q: Consider the following probability distribution for stocks A and B: State Probability Return on…
A: Given:- The following probability distribution for stocks A and B: State Probability…
Q: Problem 7.2. Let the number of customers N who walk into Hooper's store on a given day be Poisson…
A:
Q: Suppose z is a standard normal random variable. Find the z-value given probabilities: a. z-value…
A: given data standard normal distributiopnZ~N(0,1)
Q: (d) Find the probability that the rat is in compartment 3 after two moves. (e) In the long run, how…
A: The required solution of the questions asked are as in steps below.
Q: Please show all solutions and all steps. All final answers must be round up to four decimal places.…
A: Given that 1. On average daang hari experiences a car accident per day. We have to find the…
Q: 4.0 2.0 3.0 1 0 1
A: To calculate the probability of admission for a student with Verbal of 153, Quant of 154, and AWA of…
Q: Consider a Markov chain {Xn}n≥0 having the following transition diagram: For this chain, there are…
A: *Answer: *a Period of any state i is given by, C(i)= gcd{Ri} period of state 3: C(3)= gcd{3,4}=…
Q: consider a soccer player who makes a shot with the following probabilities: 1/2 if he has missed the…
A: Given The probability that a soccer player makes the shot given he has missed the last two shots…
Q: A student is buying single-serve breakfast meals for the next 10 days. The options are meat bowl,…
A: In this problem, we consider a student who is buying single-serve breakfast meals for the next 10…
Q: Determine whether the given matrix is regular. Explain your answer. P= 14 - 13 1|5 45 O Select the…
A: A matrix P is given. We know that, A square matrix P is regular if and only if P is a stochastic…
Q: A coin-operated coffee machine made by BIG Corporation was designed to discharge a mean of 7.3…
A: Null and alternative hypothesis H0:µ=7.3 H1: µ≠7.3 Suppose BIG decides to reject the null…
Q: The diagram shows the probability density function of a continuous Random Variable X. What is the…
A: Here the given graph is we have to find the value of b
Q: Texas is starting a lottery game. Play- ers use a machine that randomly selects 7 distinct numbers…
A: To calculate the probability that Texas will lose money, we need to determine the expected value of…
Q: Find the amount owed after a $40 dividend is applied toward a $216 premium.
A: Given, dividend = $40 and premium = $216.
Q: For many years, a state used 4 letters followed by 1 digit on its automobile license plates.…
A: There is total 10 digits from 0 to 9.
Q: rowbridge Manufacturing produces cases for per onal computers and other electronic equipment The…
A: Given n=6 Probability of defective cases =5%
Q: Questions Exercise 05.32 Algo (Binomial Probability Distribution) 3. 4. 5. 6. 7. 8. 9. 10. O O O O O…
A: Given that Number of trials n=12 Success of probability p=0.4 X~bin(n,p) nCx=n!/x!(n-x)! NOTE:-…
Q: (c) Find P(X < 0.3)
A: Let X be the random variable from standard normal distribution with mean = 0 and standard deviation…
Q: The scatter plot shows the relationship between the average number of times, t, a person goes to a…
A: Given: The scatterplot indicates the relationship between the average number of times (t) a person…
Q: Which of the following is/are CORRECT statement(s)? (A) The number of ways of arranging 5 boys and 5…
A: Let's first analyze the given condition that in front of each girl, the number of girls is more than…
Q: a. Of the quantities P₁, P2, X₁, X2, P₁, P2, and Pp, which represent parameters and which represent…
A: A parameter is a numerical value that depicts the characteristics of the whole population. For…
Q: 3. You are considering investing in one of two projects, which have the following returns and…
A: Hi! Thank you for the question. As per the honor code, we are allowed to answer three sub-parts at a…
Q: How many permutations of three items can be selected from a group of six? Use the letters A, B, C,…
A: 1) The objective is to find the number of permutations of selecting three items from a group of six.…
Q: What is the difference between a permutation and a combination in probability?
A: Permutations and combinations are two fundamental concepts in probability theory that involve…
Q: Do you think global warming will have an impact on you during your lifetime? A poll of 1,000 adults…
A: Since you have posted a question with multiple sub parts, we will provide the solution only to the…
Q: According to a survey on part-time workers (their monthly salaries can vary by…
A: Given: The average base salary for women is higher than the average base salary for men. The…
Q: 0 0 0 are steady-state vectors 0 3/5 0 2/5 for the Markov chain below. If the chain is equally…
A: Given information: q1=31131151100P=13141400131414001312120000023120001312
Q: 36. Consider the continuous random variable X whose cumulative distribution function (odf) is given…
A: Hi! Thank you for the question. As per the honor code, we are allowed to answer three sub-parts at a…
Q: Let X~ N(x, 16) and Y~ N(µy, 36). = = (i) Suppose we want to test Ho: μx 7 against H₁ μx = 8 at…
A: Given X~NμX, 16 Y~NμY, 36
Q: Une personality test available on the World Wide Web has a subsection designed to assess the…
A: Given information: Given claim: The population mean is greater than 142. The null hypothesis: Ho: µ…
Q: Use the Empirical Rule to solve. The graph illustrates a normal distribution for the prices paid for…
A: given data normal distributionμ = 1200σ = 140empirical rule : approximately 68-95-99.7% data fall…
Q: Problem 3 (p. 310 #6). Cauchy distribution. Suppose that a particle is fired from the origin n the…
A:
Q: c. Compute the test value. d. Make a decision on the null hypothesis. e. Make a decision on the…
A: From the given information we have identify the correct statement about the researchers claim.
Q: (+) You are a contestant on a television game show and you have won $5000 so far. You are now…
A: The data is given in the question.
Q: Probability density 0.8 0,6 0.4 GO 0.0 Normal distributions -A-B-C-D-E Which of the above normal…
A: Given: The different normal distribution curves.
Q: Ant Co. has developed a new product, the A-Warren. It is now time to bring the A-Warren product to…
A: Statement 1 is partially correct as there are two decision alternatives - to rollout the A-Warren…
Q: If a spinner has 4 sections of equal size, labeled A, B, C, and D, what is the probability of…
A: Ans#- Given, If a spinner has 4 sections of equal size, labeled A, B, C, and D, What is…
Q: My professor said the answer to question 2 is .61????
A: here given, The probability that the 9am flight departs on time is 0.81the probability suppose ,…
Q: At a particular supermarket, 85% of customers have the supermarket club-card. Determine the…
A: Given that : At a particular supermarket, 85% of customers have the supermarket club-card. Total…
Q: A random variable W has a cumulative distribution function Fw (w) = Pr(W ≤ w) shown below. Compute…
A: From the given information, FWw=PW≤w =0.1, w=50.7, w=81, w=10
Q: Students from rural, Suburban and Surban schools were asked what they thought was the most important…
A: 8) Answer:- Given data table is, Rural Suburban Urban Total Grades 57 87 103 247…
Q: For the following questions consider this setting. The deciding shot in a soccer game comes down to…
A: Please note that as per our guidelines if multiple questions are there we can answer the first…
Q: 4.30 The proportion of time Y that an industrial robot is in operation during a random variable with…
A:
Q: You roll two fair dice, one green and one red. (a) Are the outcomes on the dice independent? O Yes O…
A: Hi! Thank you for the question. As per the honor code, we are allowed to answer three sub-parts at a…
Q: Meredith is planning her wedding on a budget and is working on the bridesmaids' bouquets. She has 4…
A: If Meredith decides to make the bouquets for the bridesmaids herself, she will need to buy the…
Q: Surface-finish defects in a small electric appliance occur at random with a mean rate of 0.3 defects…
A:

Step by step
Solved in 3 steps

- Olympic Pole Vault The graph in Figure 7 indicates that in recent years the winning Olympic men’s pole vault height has fallen below the value predicted by the regression line in Example 2. This might have occurred because when the pole vault was a new event there was much room for improvement in vaulters’ performances, whereas now even the best training can produce only incremental advances. Let’s see whether concentrating on more recent results gives a better predictor of future records. (a) Use the data in Table 2 (page 176) to complete the table of winning pole vault heights shown in the margin. (Note that we are using x=0 to correspond to the year 1972, where this restricted data set begins.) (b) Find the regression line for the data in part ‚(a). (c) Plot the data and the regression line on the same axes. Does the regression line seem to provide a good model for the data? (d) What does the regression line predict as the winning pole vault height for the 2012 Olympics? Compare this predicted value to the actual 2012 winning height of 5.97 m, as described on page 177. Has this new regression line provided a better prediction than the line in Example 2?Suppose that the sales of a company (Y) is regressed on advertising expenditure (x) and labor cost (z), and the estimated regression equation is Y = 5 + 0.5x + 0.7z + u (where u is the error term). Here, sales, advertising expenditure and labor cost are measured in million Tk. Standard error for the coefficient of x is 0.04, standard error for the coefficient of z is 0.01, and the sample size is 20. Can we conclude that advertising expenditure is a statistically significant variable?17) Suppose that Y is normal and we have three explanatory unknowns which are also normal, and we have an independent random sample of 41 members of the population, where for each member, the value of Y as well as the values of the three explanatory unknowns were observed. The data is entered into a computer using linear regression software and the output summary tells us that R-square is 0.9, the linear model coefficient of the first explanatory unknown is 7 with standard error estimate 2.5, the coefficient for the second explanatory unknown is 11 with standard error 2, and the coefficient for the third explanatory unknown is 15 with standard error 4. The regression intercept is reported as 28. The sum of squares in regression (SSR) is reported as 90000 and the sum of squared errors (SSE) is 10000. From this information, what is the number of degrees of freedom for the t-distribution used to compute critical values for hypothesis tests and confidence intervals for the individual…
- 9)Suppose that Y is normal and we have three explanatory unknowns which are also normal, and we have an independent random sample of 11 members of the population, where for each member, the value of Y as well as the values of the three explanatory unknowns were observed. The data is entered into a computer using linear regression software and the output summary tells us that R-square is 0.79, the linear model coefficient of the first explanatory unknown is 7 with standard error estimate 2.5, the coefficient for the second explanatory unknown is 11 with standard error 2, and the coefficient for the third explanatory unknown is 15 with standard error 4. The regression intercept is reported as 28. The sum of squares in regression (SSR) is reported as 79000 and the sum of squared errors (SSE) is 21000. From this information, what is the adjusted R-square? .8 .7 NONE OF THE OTHERS .6 .58)Suppose that Y is normal and we have three explanatory unknowns which are also normal, and we have an independent random sample of 11 members of the population, where for each member, the value of Y as well as the values of the three explanatory unknowns were observed. The data is entered into a computer using linear regression software and the output summary tells us that R-square is 0.86, the linear model coefficient of the first explanatory unknown is 7 with standard error estimate 2.5, the coefficient for the second explanatory unknown is 11 with standard error 2, and the coefficient for the third explanatory unknown is 15 with standard error 4. The regression intercept is reported as 28. The sum of squares in regression (SSR) is reported as 86000 and the sum of squared errors (SSE) is 14000. From this information, what is MSE/MST? .5000 NONE OF THE OTHERS .2000 .3000 .40001. Suppose that the sales of a company (Y) is regressed on advertising expenditure (x) and labor cost (z), and the estimated regression equation is Y = 5 + 0.5x + 0.7z + u (where u is the error term). Here, sales, advertising expenditure and labor cost are measured in million Tk. Standard error for the coefficient of x is 0.4, standard error for the coefficient of z is 0.01, and the sample size is 20. Based on this information, find out whether labor cost is a statistically significant variable using an appropriate statistical test.
- Suppose that researchers are interested in determining the bi-annual salary of statisticians of different levels using their years of experience and their education level (M = bachelors, P = doctorate). They fit the following model to a dataset that includes these variables and, after performing the proper steps of multiple linear regression, the following multiple linear regression model is obtained: yˆ = 42308 + 323x1 + 213x2 + 301(x1*x2) where the variables are as follows: yˆ = predicted bi−annual salary in dollars, x1 = number of years of experiencex2= {1 if the education level is a doctorate 0 if the education level is a bachelors What is the predicted bi-annual salary in dollars of an employee with 5 years of experience and a bachelor’s degree?Suppose that researchers are interested in determining the bi-annual salary of statisticians of different levels using their years of experience and their education level (M = bachelors, P = doctorate). They fit the following model to a dataset that includes these variables and, after performing the proper steps of multiple linear regression, the following multiple linear regression model is obtained: yˆ = 42308 + 323x1 + 213x2 + 301(x1*x2) where the variables are as follows: yˆ = predicted bi−annual salary in dollars, x1 = number of years of experiencex2= {1 if the education level is a doctorate 0 if the education level is a bachelors What is the predicted bi-annual starting salary of an employee with a doctorate degree? (Someone with no work experience). $ What is the predicted bi-annual starting salary of an employee with a bachelor’s degree? (Someone with no work experience). $3. The following Table gives data on output per hour (X) and real compensation per hour (Y) for the business and nonfarm business sectors of the U.S. economy. Year 1990 Y X 1991 1 10 1992 3 15 4 20 Estimate the slope of the OLS regression of Y on X (ẞ2) from the following regression: Yi = β₁ + β2 Xi + Ui
- The data in Table 11.17 are given for 9 patients with aplastic anemia [11]. *11.1 Fit a regression line relating the percentage of reticulocytes (x) to the number of lymphocytes (y). *11.2 Test for the statistical significance of this regression line using the F test. *11.3 What is R2 for the regression line in Problem 11.1?1) What is the slope(b1) and what is its statistical interpretation? 2) Perform the test of hypothesis (t-test) on the following and state your statistical decision. Use α = 0.01. Please show all the relevant calculations. H0: β1 = 0 H1: β1 ≠ 0 3) Perform the test of hypothesis (F-test) on the following and state your statistical decision. Use α = 0.01. Please show all the relevant calculations. H0: β1 = 0 H1: β1 ≠ 0 4) What is the coefficient of determination (r2) i.e., percentage of variability in the monthly rent explained by the independent variable rental property area? Please show all the relevant calculations. 5) What is the 99% confidence interval for the population slope(β1)? Please show all the relevant calculations.?Consider the following population linear regression model of individual food expenditure: Y = 50 + 0.5X + u, where Y is weekly food expenditure in dollars, X is the individual’s age, and 50+0.5X is the population regression line. Suppose we generate artificial data for 3 individuals using this model. This artificial sample, which consists of 3 observations, is shown in the following table: Answer the following questions. Show your working. (a) What are the values of V1 and V4? (b) Suppose we know that in this artificial sample, the sample covariance between X and Y is 150, and the sample variance of X is 100. Compute the OLS regression line of the regression of Y on X. (Hint: Assume these summary statistics and the OLS regression line continue to hold in parts (c)-(e).) (c) What are the values of V5 and V7?