1) What is the slope(b1) and what is its statistical interpretation?


Q: Two lines of regression are given by 5x+7y-22=0 and 6x+2y-22=0. If the variance of y is 15, find the…
A: Given: 5x+7y-22=0 6x+2y-22=0 V(y) = σx2= 15 Now, the regression equation y on x is, y = -3x + 11 x…
Q: IQ scores were obtained from randomly selected adopted children living together. For 20 such pairs…
A: The equation of the regression line is y=-3.22+1.02x.
Q: A scientist claims that there is a linear relationship between a lake’s flow rate and its runoff…
A: State the hypotheses.
Q: A football coach is looking for a way to identify players that are "under weight". The coach decides…
A: Answer is 210 pounds
Q: Assume the World Health Organization believes that physician access has an effect on life…
A: 1. Consider that β is the slope coefficient.
Q: An urban community wants to show that the incidence of breast cancer is higher in their locality…
A: Hi! Thank you for the question, As per the honor code, we are allowed to answer three sub-parts at a…
Q: Suppose you estimated the multiple linear regression of y on x1 and x2, and found that the estimated…
A: Introduction: There are two models considered here: Model 1: Multiple linear regression model of y…
Q: Suppose the simple linear regression model, Yi = β0 + β1 xi + Ei, is used to explain the…
A: Solution: Given information: n= 12 ∑xi= 20∑yi= 45∑xiyi=32∑xi2= 135∑yi2= 1025
Q: Data from the Motor Vehicle Department indicate that 80% of all licensed drivers are older than age…
A: (A). Propose the suitable analysis: Denote the proportion of licensed drivers who are older than 25…
Q: A simple linear regression was estoblished between two variables, and it was found that the F ratio…
A: Given that a simple linear regression was established between two variables, and it was found that…
Q: In 1950, Americans slept an average of 8.1 hours per night, while in 1972 the average was 7.4 hours…
A: In this case, SSR – 1.43 and MSE = 0.05.
Q: Suppose that the sales of a company (Y) is regressed on advertising expenditure (x) and labor cost…
A: Here the Regression equation is provided as : sales of a company (Y) advertising expenditure (x)…
Q: For variables x1, x2, x3, and y satisfying the assumptions for multiple linear regression…
A:
Q: The least-squares regression equation is y=647.8x+17,858 where y is the median income and x is the…
A: The regression equation is given, y= 647.8 x+17,858 y=median income x=the percentage of 25 years…
Q: How can I calculate the different values in the equation y=ax+b for the regression line of a sample?…
A: The form of the simple linear regression is given by,
Q: A dietitian wishes to see if a person’s cholesterol level will be changed if the diet is…
A: Given, By applying a paired-t test,
Q: a. Find the sum of X^2: b. Find the Correlation coefficient: c Estimate the slope of the regression…
A: a. The sum of X2 is, ∑X2=92+42+00+82+62=81+16+0+64+36=197 Thus, the sum of X2 is 197.
Q: A football coach is looking for a way to identify players that are "under weight". The coach decides…
A: Answer is 155 pounds
Q: A football coach is looking for a way to identify players that are "under weight". The coach decides…
A: 198.24 pounds Here we are interested in finding lower confidence bound for x=67 y= -58+4(67) y= 210…
Q: B6. Data were collected for the fuel consumption, y, of 10 cars of each of k = 3 brands, i.e. n =…
A:
Q: )Suppose that Y is normal and we have three explanatory unknowns which are also normal, and we have…
A: There are 11 members and 3 explanatory variables. Thus, n=11 and k=3. It is given that SSR=86,000…
Q: o a computer using linear regression software and the output summary tells us that R-square is 0.79,…
A:
Q: Here is a bivariate data set. Find the regression equation for the response variable y. x y 55.1…
A: Regression: Regression is a technique that is used to determine relationship between two or more…
Q: A researcher is going to conduct a regression line and created the following scatter plot that…
A: In multiple linear regression, there will be more than one independent variable. In simple linear…
Q: The regression equation is Ŷ = 29.29 − 0.58X, the sample size is 10, and the standard error of the…
A: It is given that the regression line is Y^=29.29-0.58X. The sample size is n=10. The level of…
Q: The regression equation is Ý = 29.29 – 0.96X, the sample size is 8, and the standard error of the…
A: Given that Sample size n = 8 Standard error of slope = 0.22 Level of significance = 0.01
Q: A researcher was interested in investigating whether the parent-child interaction time (in hours) is…
A: Hi! Thank you for the question, As per the honor code, we are allowed to answer three sub-parts at a…
Q: rou have a dummy variable and an interaction term in the same regression model, the coefficient…
A: It is known that, The regression equation is given by, Y= a+bX Where a is intercept and b is slope.…
Q: A football coach is looking for a way to identify players that are "under weight". The coach decides…
A: Simple Linear regression : Simple linear regression is useful to measure the association or linear…
Q: Two regression lines of a sample are X+6 Y=6 and 3X+2Y=0. Find the correlation coefficient.
A:
Q: 5. The expected sales (in RM) of a produet are assumed to be influenced by the amount of money (in…
A: Given: Sample size n=18 Significance level α=0.05 Regression model: y^=β0+β1x Where,…
Q: (b) When one estimates the linear regression y = Bo + B1x1 + · · · + Bpxk + u, it is necessary to…
A:
Q: The head of the production department of a RM Electronic Company wants to determine the relationship…
A: 1) The head of the production department of a RM Electronic Company wants to determine the…
Q: 4. A company manufactures drugs intended to lower the cholesterol level (Y, measured in mg/dL) in…
A: Given information: Probability of assigning patient to treatement group=23Probability of assigning…
Q: On the second sheet is data which shows the rate of growth of a particular patch of bamboo vs daily…
A: a. Procedure for obtaining Scatter plot in excel : Step 1: Select the data. Step 2: Select the…
Q: If the R-square value for a simple linear regression model is 0.80 and the regression line has a…
A: Given that R2 = 0.80 And regression line has a negative slope
Q: For a sample of 74 monthly observations, the regression of the percentage return on gold (y) against…
A: The sample regression line is provided for a sample of 74 monthly observations as; y = -0.003 +…
Q: The least-squares regression equation is y=761.7x+13,208 where y is the median income and x is the…
A: The least-squares regression equation is y=761.7x+13208 The linear relation between the two…
Q: You are testing the null hypothesis that there is no linear relationship between two variables, X…
A: You are testing the null hypothesis that there is no linear relationship between two variables, X…
Q: For variables x1, x2, x3 and y satisfying the assumptions for multiple linear regression inferences,…
A:
Q: For the population of Jellystone bears, the mean weight is 500 pounds and the mean blood pressure is…
A: Here, Y = Blood pressure and X = Weight. Given info: β1=0.05, x=500 and y¯=150
Q: 3. A Ross MAP team is trying to estimate the revenues of major-league baseball teams during the…
A: Here, already we are having the feature for number winning of games, no need to add number of loosed…
Q: 17) Suppose that Y is normal and we have three explanatory unknowns which are also normal, and we…
A:
Q: 5) Use the model'equation to predict the value of y using any x value of your choice within the…
A: Since you have posted a question with multiple subparts, we will solve first three subparts for you.…
Q: Derive the standard error of the point estimator Bo-
A:
Q: A study was conducted to investigate the number of collisions possible between bumper cars at an…
A:
Q: 4. Consider a multiple linear regression model with two independent variables with 12 values in each…
A:
Q: In a regression model involving 30 observations, the following estimated regression equation was…
A:
Q: Suppose that x and y are two variables of a population and that the assumptions for regression…
A:
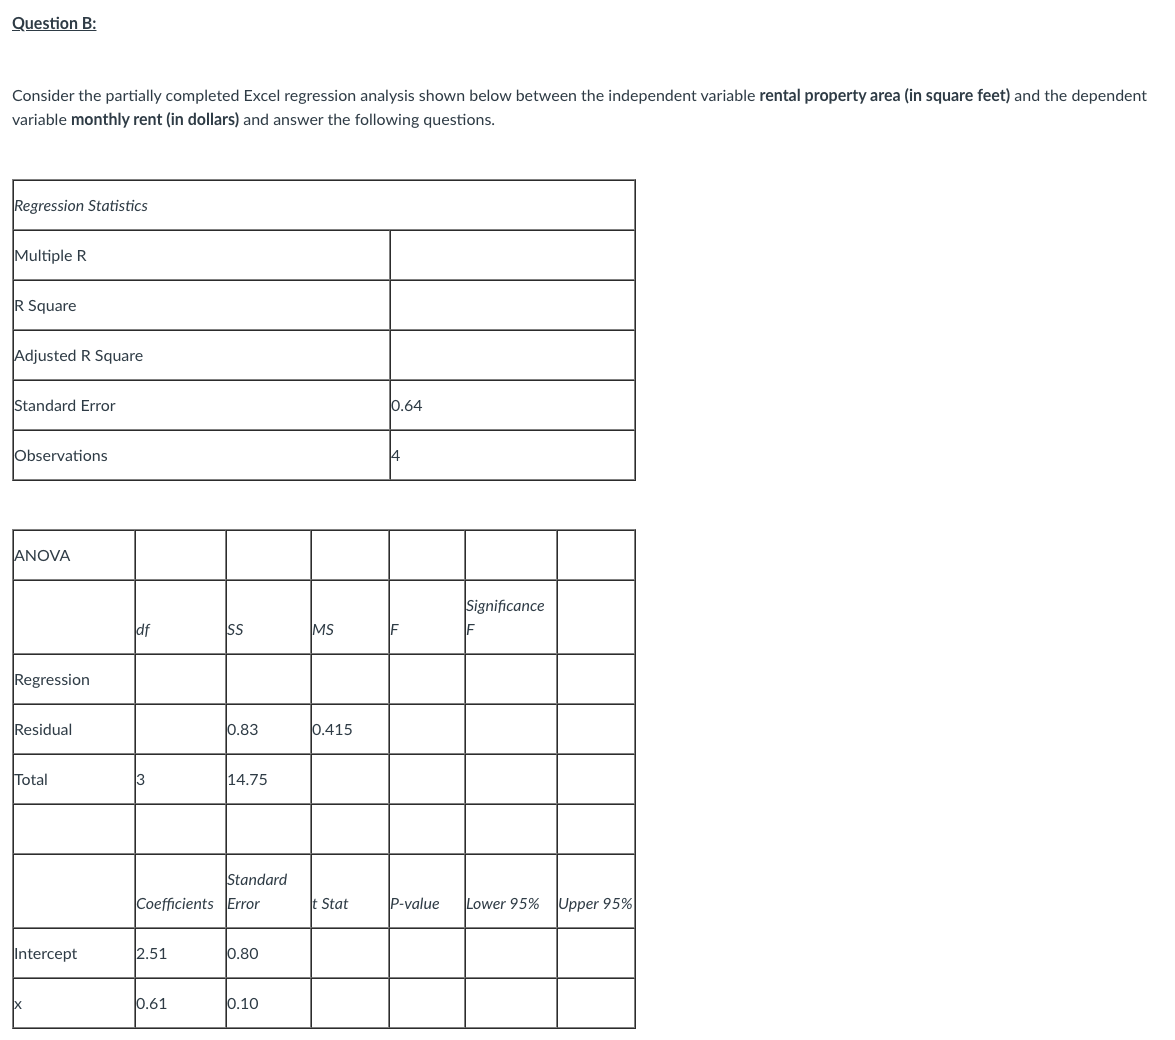
1) What is the slope(b1) and what is its statistical interpretation?
2) Perform the test of hypothesis (t-test) on the following and state your statistical decision.
Use α = 0.01. Please show all the relevant calculations.
H0: β1 = 0
H1: β1 ≠ 0
3) Perform the test of hypothesis (F-test) on the following and state your statistical decision.
Use α = 0.01. Please show all the relevant calculations.
H0: β1 = 0
H1: β1 ≠ 0
4) What is the coefficient of determination (r2) i.e., percentage of variability in the monthly rent explained by the independent variable rental property area? Please show all the relevant calculations.
5) What is the 99% confidence interval for the population slope(β1)? Please show all the relevant calculations.?


Trending now
This is a popular solution!

Step by step
Solved in 3 steps with 2 images

- Find the equation of the regression line for the following data set. x 1 2 3 y 0 3 4A researcher interested in explaining the level of foreign reserves for the country of Barbados estimated the following multiple regression model using yearly data spanning the period 2001 to 2016: ??=?+????+????+???I Where FR = yearly foreign reserves ($000’s), OIL = annual oil prices, EXP = yearly total exports ($000’s) and FDI = annual foreign direct investment ($000’s). The sample of data was processed using MINITAB and the following is an extract of the output obtained: Predictor Coef StDev t-ratio p-value Constant 5491.38 2508.81 2.1888 0.0491 Oil 85.39 18.46 4.626 0.0006 EXP -377.08 112.19 * 0.0057 FDI -396.99 160.66 -2.471 ** S = 2.45 R – sq = 96.3% R – sq (adj) = 95.3% Analysis of Variance Source DF SS MS F P Regression 3 1991.31 663.77 ? ?? Error 12 77.4 6.45 Total 15 e) Perform the F Test making sure to state…A researcher interested in explaining the level of foreign reserves for the country of Barbados estimated the following multiple regression model using yearly data spanning the period 2001 to 2016: ??=?+????+????+???? Where FR = yearly foreign reserves ($000’s), OIL = annual oil prices, EXP = yearly total exports ($000’s) and FDI = annual foreign direct investment ($000’s). The sample of data was processed using MINITAB and the following is an extract of the output obtained: Predictor Coef StDev t-ratio p-value Constant 5491.38 2508.81 2.1888 0.0491OIL 85.39 18.46 4.626 0.0006EXP -377.08 112.19 * 0.0057FDI -396.99 160.66 -2.471 ** S = 2.45 R-sq = 96.3% R-sq(adj) = 95.3% Analysis of VarianceSource DF SS…
- A researcher interested in explaining the level of foreign reserves for the country of Barbados estimated the following multiple regression model using yearly data spanning the period 2001 to 2016: ??=?+????+????+???? Where FR = yearly foreign reserves ($000’s), OIL = annual oil prices, EXP = yearly total exports ($000’s) and FDI = annual foreign direct investment ($000’s). The sample of data was processed using MINITAB and the following is an extract of the output obtained: Predictor Coef StDev t-ratio p-value Constant 5491.38 2508.81 2.1888 0.0491 OIL 85.39 18.46 4.626 0.0006 EXP -377.08 112.19 * 0.0057 FDI -396.99 160.66 -2.471 ** S = 2.45 R-sq = 96.3% R-sq(adj) = 95.3%…A researcher interested in explaining the level of foreign reserves for the country of Barbados estimated the following multiple regression model using yearly data spanning the period 2001 to 2016: ??=?+????+????+???? Where FR = yearly foreign reserves ($000’s), OIL = annual oil prices, EXP = yearly total exports ($000’s) and FDI = annual foreign direct investment ($000’s). The sample of data was processed using MINITAB and the following is an extract of the output obtained: Predictor Coef StDev t-ratio p-value Constant 5491.38 2508.81 2.1888 0.0491 OIL 85.39 18.46 4.626 0.0006 EXP -377.08 112.19 * 0.0057 FDI -396.99 160.66 -2.471 ** S = 2.45 R-sq = 96.3% R-sq(adj) = 95.3% Analysis of Variance Source DF SS MS F p Regression 3 1991.31 663.77 ? ?? Error 12 77.4 6.45 Total 15 a). Fill in the missing values ‘*’, ‘**’,…A researcher interested in explaining the level of foreign reserves for the country of Barbados estimated the following multiple regression model using yearly data spanning the period 2001 to 2016: ??=?+????+????+???? Where FR = yearly foreign reserves ($000’s), OIL = annual oil prices, EXP = yearly total exports ($000’s) and FDI = annual foreign direct investment ($000’s). The sample of data was processed using MINITAB and the following is an extract of the output obtained: Predictor Coef StDev t-ratio p-value Constant 5491.38 2508.81 2.1888 0.0491 OIL 85.39 18.46 4.626 0.0006 EXP -377.08 112.19 * 0.0057 FDI -396.99 160.66 -2.471 ** S = 2.45 R-sq = 96.3% R-sq(adj) = 95.3% Analysis of Variance Source DF SS MS F p…
- A researcher interested in explaining the level of foreign reserves for the country of Barbados estimated the following multiple regression model using yearly data spanning the period 2001 to 2016: ??=?+????+????+???? Where FR = yearly foreign reserves ($000’s), OIL = annual oil prices, EXP = yearly total exports ($000’s) and FDI = annual foreign direct investment ($000’s). The sample of data was processed using MINITAB and the following is an extract of the output obtained: Predictor Coef StDev t-ratio p-value Constant 5491.38 2508.81 2.1888 0.0491 Oil 85.39 18.46 4.626 0.0006 EXP -377.08 112.19 * 0.0057 FDI -396.99 160.66 -2.471 ** S = 2.45 R – sq = 96.3% R – sq (adj) = 95.3% Analysis of Variance Source DF S MS…A researcher interested in explaining the level of foreign reserves for the country of Barbados estimated the following multiple regression model using yearly data spanning the period 2001 to 2016: ??=?+????+????+???? Where FR = yearly foreign reserves ($000’s), OIL = annual oil prices, EXP = yearly total exports ($000’s) and FDI = annual foreign direct investment ($000’s). The sample of data was processed using MINITAB and the following is an extract of the output obtained: Predictor Coef StDev t-ratio p-valueConstant 5491.38 2508.81 2.1888 0.0491OIL 85.39 18.46 4.626 0.0006EXP -377.08 112.19 * 0.0057FDI -396.99 160.66 -2.471 ** S = 2.45 R-sq = 96.3% R-sq(adj) = 95.3%…A researcher interested in explaining the level of foreign reserves for the country of Barbados estimated the following multiple regression model using yearly data spanning the period 2001 to 2016: ??=?+????+????+???? Where FR = yearly foreign reserves ($000’s), OIL = annual oil prices, EXP = yearly total exports ($000’s) and FDI = annual foreign direct investment ($000’s). The sample of data was processed using MINITAB and the following is an extract of the output obtained: Predictor Coef StDev t-ratio p-value Constant 5491.38 2508.81 2.1888 0.0491 OIL 85.39 18.46 4.626 0.0006 EXP -377.08 112.19 * 0.0057 FDI -396.99 160.66 -2.471 ** S = 2.45 R-sq = 96.3% R-sq(adj) = 95.3% Analysis of Variance Source DF SS MS F p Regression 3 1991.31 663.77 ? ?? Error 12 77.4 6.45 Total 15 Fill in the missing values ‘*’, ‘**’, ‘?’and ‘??’…
- A researcher interested in explaining the level of foreign reserves for the country of Barbados estimated the following multiple regression model using yearly data spanning the period 2001 to 2016: ??=?+????+????+???? Where FR = yearly foreign reserves ($000’s), OIL = annual oil prices, EXP = yearly total exports ($000’s) and FDI = annual foreign direct investment ($000’s). The sample of data was processed using MINITAB and the following is an extract of the output obtained: Predictor Coef StDev t-ratio p-value Constant 5491.38 2508.81 2.1888 0.0491 Oil 85.39 18.46 4.626 0.0006 EXP -377.08 112.19 * 0.0057 FDI -396.99 160.66 -2.471 ** S = 2.45 R – sq = 96.3% R – sq (adj) = 95.3% Analysis of Variance Source…A researcher interested in explaining the level of foreign reserves for the country of Barbados estimated the following multiple regression model using yearly data spanning the period 2001 to 2016: ??=?+????+????+???? Where FR = yearly foreign reserves ($000’s), OIL = annual oil prices, EXP = yearly total exports ($000’s) and FDI = annual foreign direct investment ($000’s). The sample of data was processed using MINITAB and the following is an extract of the output obtained: Predictor Coef StDev t-ratio p-value Constant 5491.38 2508.81 2.1888 0.0491 OIL 85.39 18.46 4.626 0.0006 EXP -377.08 112.19 * 0.0057 FDI -396.99 160.66 -2.471 ** S = 2.45 R-sq = 96.3% R-sq(adj) = 95.3%…The certain study seeks to investigate whether negative life events, family environment, family violence, media violence, and depression are predictors of youth aggression and bullying. Which of the following statistical tests is most appropriate to answer this objective? a. Linear Regression b. McNemar's Test c. Chi-square Test d. Multiple Logistic Regression


