4. Monopoly In the market for Intellectual property Epticon is launching some new software. Developing the new software involves a relatively high fixed cost of roughly $16 million. Epticon's marginal cost of producing the software is zero. Having obtained a copyright, Epticon acts as a monopolist in the market for its new software. The following graph shows the demand, marginal revenue (MR), and average total cost (ATC) curves for the software. Keeping in mind that the marginal cost (MC) of production is zero, the profit- maximizing quantity of the software is 400,000 units, and the profit-maximizing price is $80 per unit of software. On the graph, use the green triangle (triangle symbols) to shade the area that represents consumer surplus at Epticon's profit-maximizing price. Then use the grey rectangle (star symbols) to shade the area that represents total cost at the profit-maximizing output level. Finally, use the orange rectangle (square symbols) to shade the area that represents Epticon's profit at the profit-maximizing price and quantity. (?) 160 140 Consumer Surplus 120 100 Total Cost Profit GO 40 Gain in Surplus AC 20 MR 3. 5. QUANTITY (Hundreds of thousands) PRICE (Dollars)
4. Monopoly In the market for Intellectual property Epticon is launching some new software. Developing the new software involves a relatively high fixed cost of roughly $16 million. Epticon's marginal cost of producing the software is zero. Having obtained a copyright, Epticon acts as a monopolist in the market for its new software. The following graph shows the demand, marginal revenue (MR), and average total cost (ATC) curves for the software. Keeping in mind that the marginal cost (MC) of production is zero, the profit- maximizing quantity of the software is 400,000 units, and the profit-maximizing price is $80 per unit of software. On the graph, use the green triangle (triangle symbols) to shade the area that represents consumer surplus at Epticon's profit-maximizing price. Then use the grey rectangle (star symbols) to shade the area that represents total cost at the profit-maximizing output level. Finally, use the orange rectangle (square symbols) to shade the area that represents Epticon's profit at the profit-maximizing price and quantity. (?) 160 140 Consumer Surplus 120 100 Total Cost Profit GO 40 Gain in Surplus AC 20 MR 3. 5. QUANTITY (Hundreds of thousands) PRICE (Dollars)

Chapter9: Monopoly
Section: Chapter Questions
Problem 2.3P

Related questions
Question
The graph
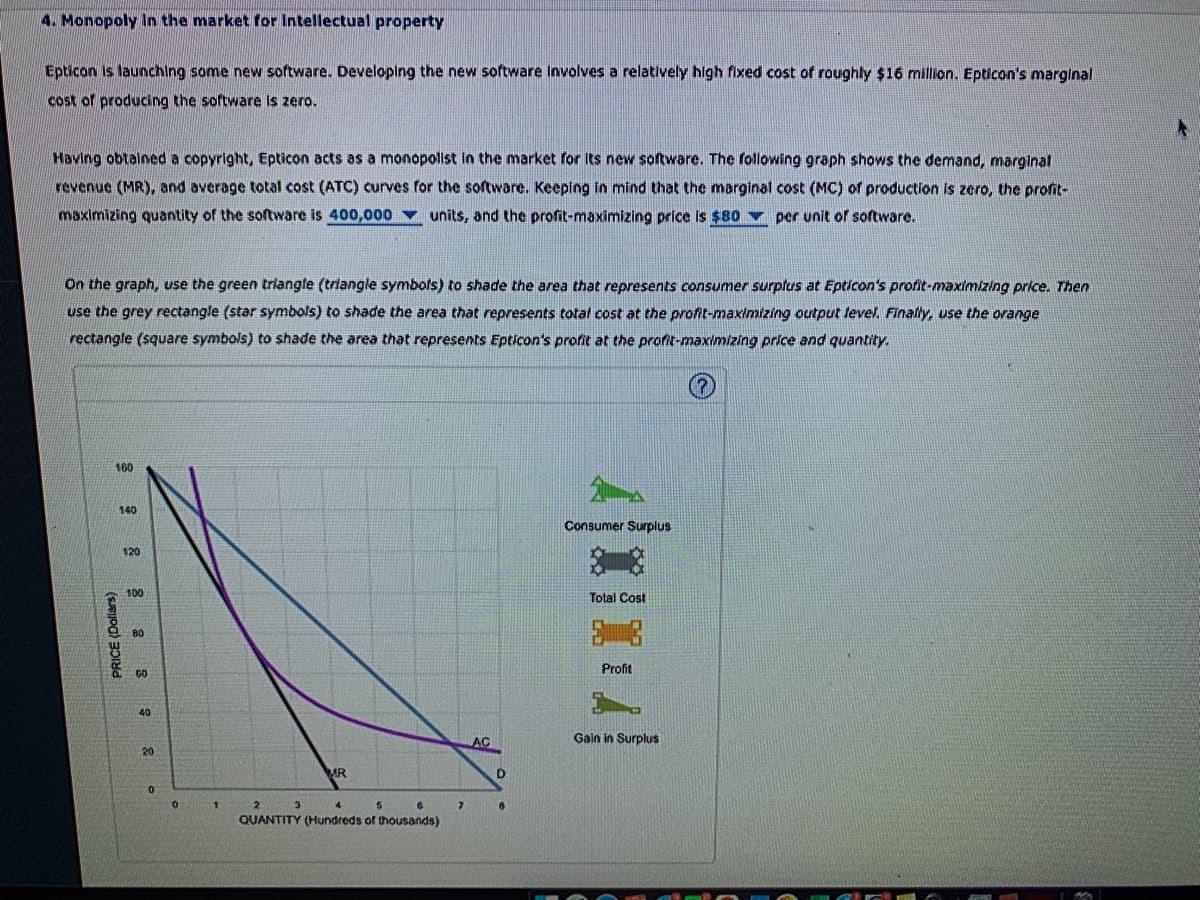
Transcribed Image Text:4. Monopoly In the market for Intellectual property
Epticon is launching some new software. Developing the new software Involves a relatively high fixed cost of roughly $16 million. Epticon's marginal
cost of producing the software Is zero.
Having obtained a copyright, Epticon acts as a monopolist in the market for its new software. The following graph shows the demand, marginal
revenue (MR), and average total cost (ATC) curves for the software. Keeping in mind that the marginal cost (MC) of production is zero, the profit-
maximizing quantity of the software is 400,000 units, and the profit-maximizing price is $80 per unit of software.
On the graph, use the green triangle (triangle symbols) to shade the area that represents consumer surplus at Epticon's profit-maximizing price. Then
use the grey rectangle (star symbols) to shade the area that represents total cost at the profit-maximizing output level. Finally, use the orange
rectangle (square symbois) to shade the area that represents Epticon's profit at the profit-maximizing price and quantity.
160
140
Consumer Surplus
120
100
Total Cost
80
Profit
GO
40
AC
Gain in Surplus
20
MR
4.
QUANTITY (Hundreds of thousands)
PRICE (Dollars)
Expert Solution
This question has been solved!
Explore an expertly crafted, step-by-step solution for a thorough understanding of key concepts.

This is a popular solution!

Trending now
This is a popular solution!

Step by step
Solved in 2 steps with 1 images

Knowledge Booster


Learn more about
Need a deep-dive on the concept behind this application? Look no further. Learn more about this topic, economics and related others by exploring similar questions and additional content below.Recommended textbooks for you

Essentials of Economics (MindTap Course List)
Economics
ISBN:
9781337091992
Author:
N. Gregory Mankiw
Publisher:
Cengage Learning

Principles of Economics (MindTap Course List)
Economics
ISBN:
9781305585126
Author:
N. Gregory Mankiw
Publisher:
Cengage Learning
Essentials of Economics (MindTap Course List)
Economics
ISBN:
9781337091992
Author:
N. Gregory Mankiw
Publisher:
Cengage Learning
Principles of Economics (MindTap Course List)
Economics
ISBN:
9781305585126
Author:
N. Gregory Mankiw
Publisher:
Cengage Learning

Principles of Microeconomics (MindTap Course List)
Economics
ISBN:
9781305971493
Author:
N. Gregory Mankiw
Publisher:
Cengage Learning

Principles of Economics, 7th Edition (MindTap Cou…
Economics
ISBN:
9781285165875
Author:
N. Gregory Mankiw
Publisher:
Cengage Learning

Principles of Microeconomics
Economics
ISBN:
9781305156050
Author:
N. Gregory Mankiw
Publisher:
Cengage Learning