
Concept explainers
Videos
INTERPRET DATA Examine the top and middle graphs in Figure 54-5. Are these examples of exponential or
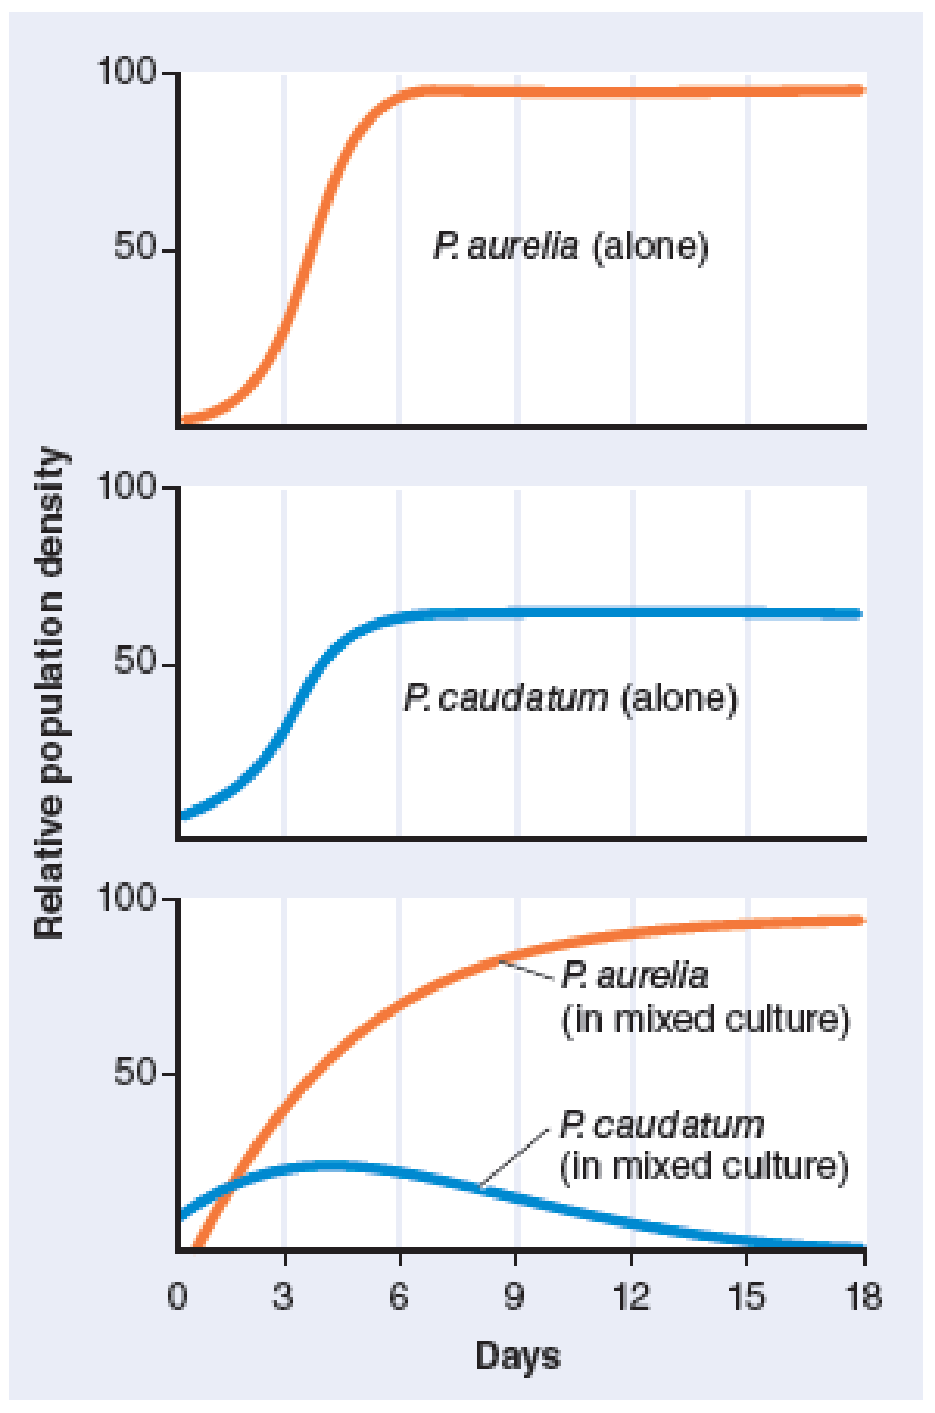
RESULTS AND CONCLUSION: The top and middle graphs show how each species of Paramecium flourishes when grown alone. The bottom graph shows how they grow together, in competition with each other. In a mixed culture, P. aurelia outcompetes P. caudatum, resulting in competitive exclusion.
SOURCE: Adapted from G.F. Gause, The Struggle for Existence (Williams and Wilkins, Baltimore, 1934).
Figure 54-5 G.F. Gause’s classic experiment on interspecific competition

Trending nowThis is a popular solution!

Chapter 54 Solutions
Biology (MindTap Course List)
Additional Science Textbook Solutions
Genetics: Analysis and Principles
Study Guide for Campbell Biology
Microbiology with Diseases by Body System (5th Edition)
Anatomy & Physiology
Microbiology: Principles and Explorations


- Examine the top and middle graphs in Figure 54-5. Are these examples of exponential or logistic population growth? Where is K in each graph?arrow_forwardA population that grew in close relation to the amount of resources available in the environment, would experience A. exponential growth, such as shown on the J-shaped curve B. logistic growth, such as shown on the S-shaped curve C. unpredictable growth, such as shown on the ?-shaped curve D.logistic growth, such as shown on the J-shaped curve E. exponential growth, such as shown on the S-shaped curvearrow_forwardShow how you build the logistic model for population growth from the exponential model equation? What part of the logistic growth equation produces the sigmoidal growth curve?arrow_forward
- Explain the difference between logistic and exponential population growth. What do these growth curves look like. Which represents human population growth over the last few thousand years?arrow_forwardThe type of growth that occurs in a population that grows by a constant percentage per year is________ . Does this form of growth add the same number of individuals each year?_______ What shape of curve is generated if this type of growth is graphed?______ Can this type of growth be sustained indefinitely?______arrow_forwardIn a closed system, a pair of houseflies is provided with a garbage can full of food waste. Which of the following graphs describes the growth of housefly population?arrow_forward
- Contrast exponential and logistic (= sigmoid) growth of a population. Under what conditions might you expect a population to exhibit ex-ponential growth? Why can exponential growth not be perpetuated indefinitely?arrow_forwardHow does the study of population ecology help us understand why some populations grow, some remain stable and others decline? The human population has grown as we have increased our global carrying capacity. In your opinion, can the global carrying capacity continue to increase/ Explain your answer? Why has human population growth, which increased exponentially for centuries, started to decline in the past few decades?arrow_forwardAssume that the population of the greater roadrunner in the Guadelope Desert was 250 per hectare at the beginning of 1999. If the carrying capacity, K , is 750 and r=0.25 per year, what is the number ofroadrunners: (a) after a year later, (b) ten years later, (c) after a score, (d) a century later, and (e) a millennium later?arrow_forward
- Assuming the original 10 organisms grew exponentially, doubling in size with every unit of time, calculate the population size from t0 to t4 and draw the position of this curve on your graph. Adjust your figure legend.arrow_forwardScenario part 2 Imagine you, a researcher, return to this same population after 30 years and you see blue, green, yellow, and orange frogs. Questions part 2 name 1 key agent of microevolution that could be responsible for the appearance of orange frogs in this population. (just 1) name 1 key agent of microevolution that could NOT be responsible for the appearance of orange frogs in this population (just 1)arrow_forwardAssuming the original 10 organisms grew exponentially, doubling in size with every unit of time, calculate the population size from t0 to t4arrow_forward
 Biology (MindTap Course List)BiologyISBN:9781337392938Author:Eldra Solomon, Charles Martin, Diana W. Martin, Linda R. BergPublisher:Cengage Learning